Swap
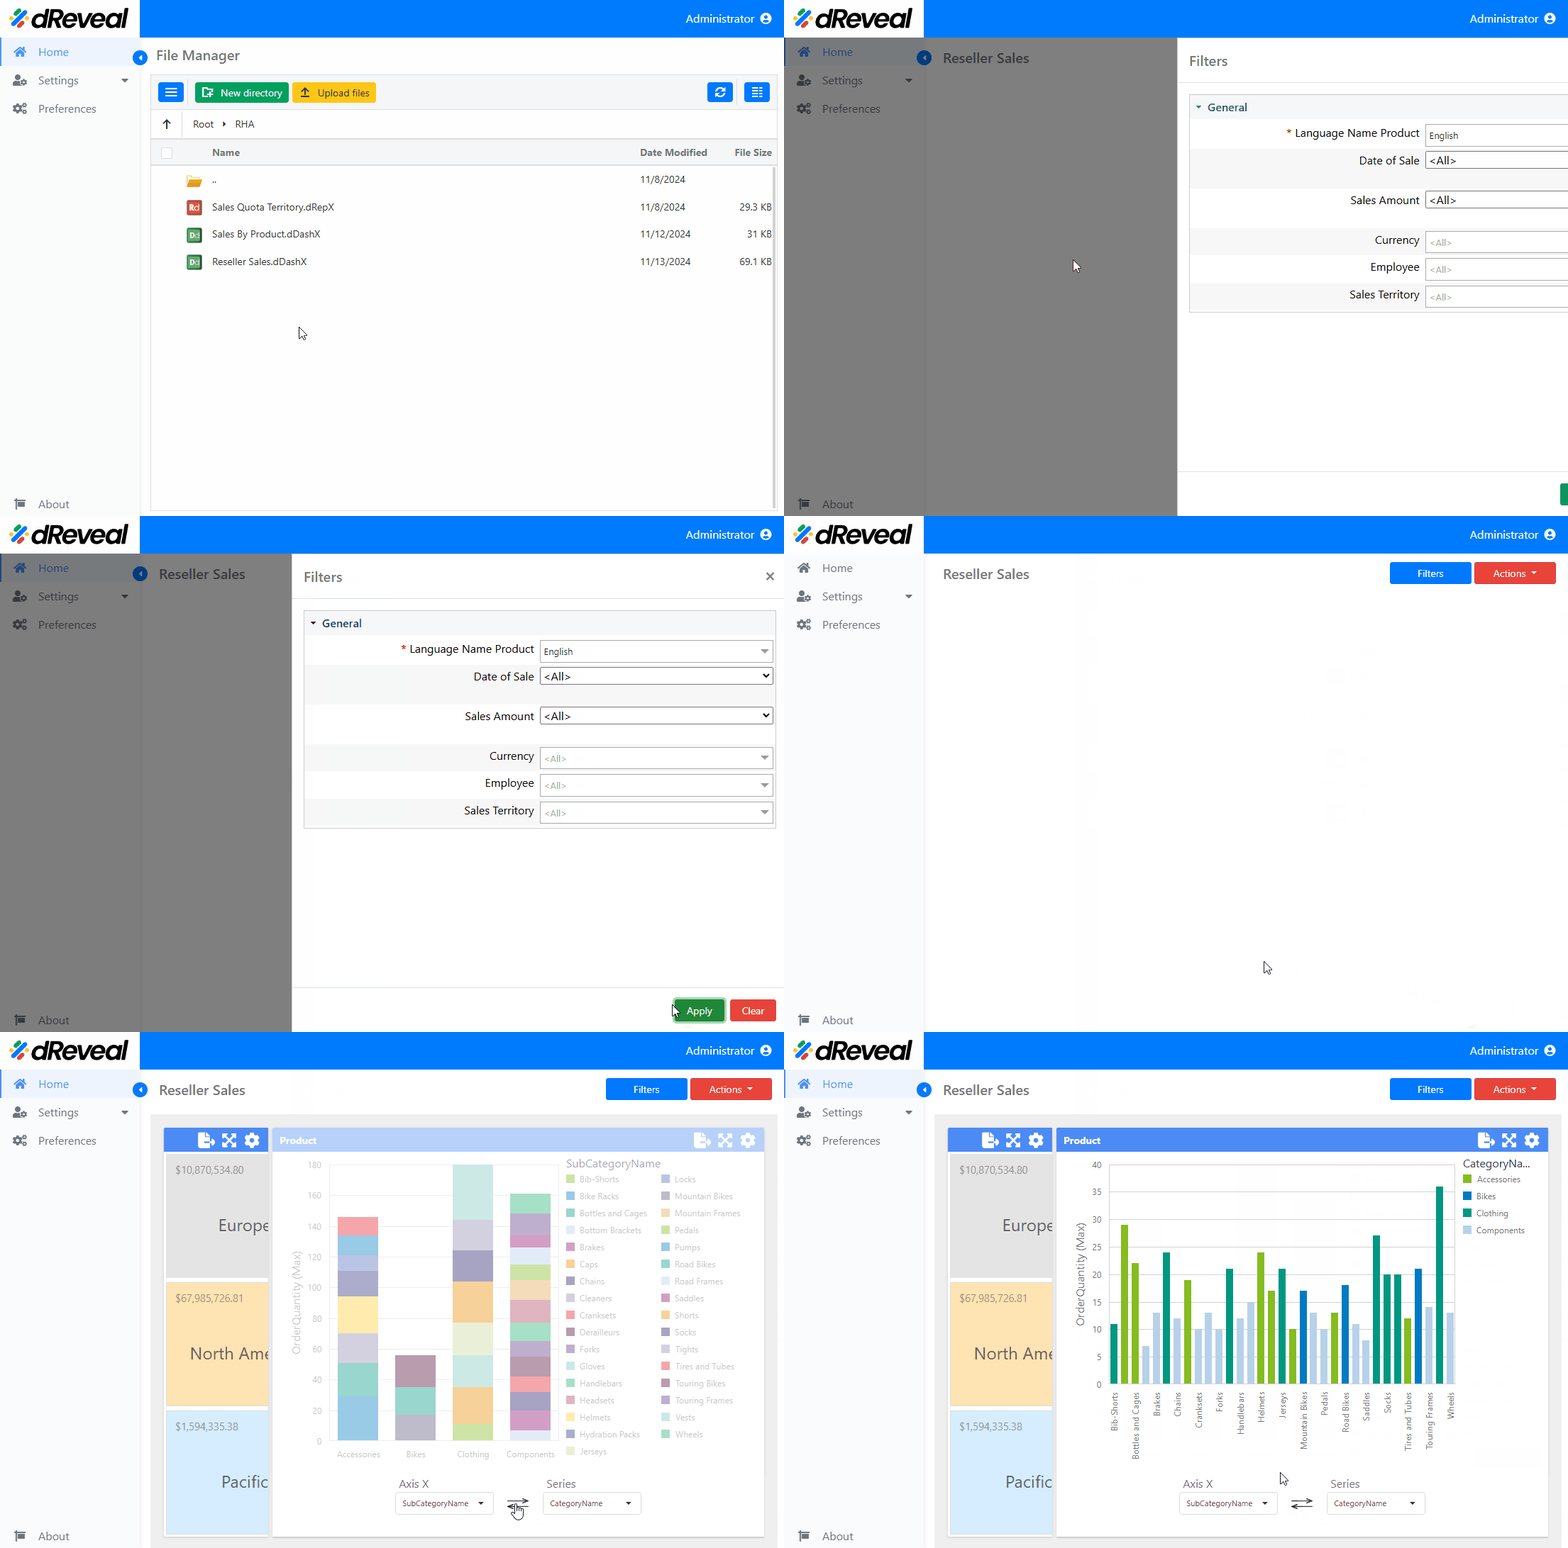
The Swap option in a chart allows users to switch the position of the "Y Axis" with the "Series," providing a flexible and dynamic way to analyze data.
Note: The Swap option is displayed with an icon of arrows between the "Axis Y" and "Series" dropdown menus.
How to Apply Swap
To apply Swap in a chart, first enter your username and password, then click the Login button. Once logged in, navigate to the report you wish to execute and double-click on it to open. Next, click the Apply button to display the report. Once the report is loaded, click the Swap icon (the arrows between the "Y Axis" and "Series" dropdown menus).

