Master Filter

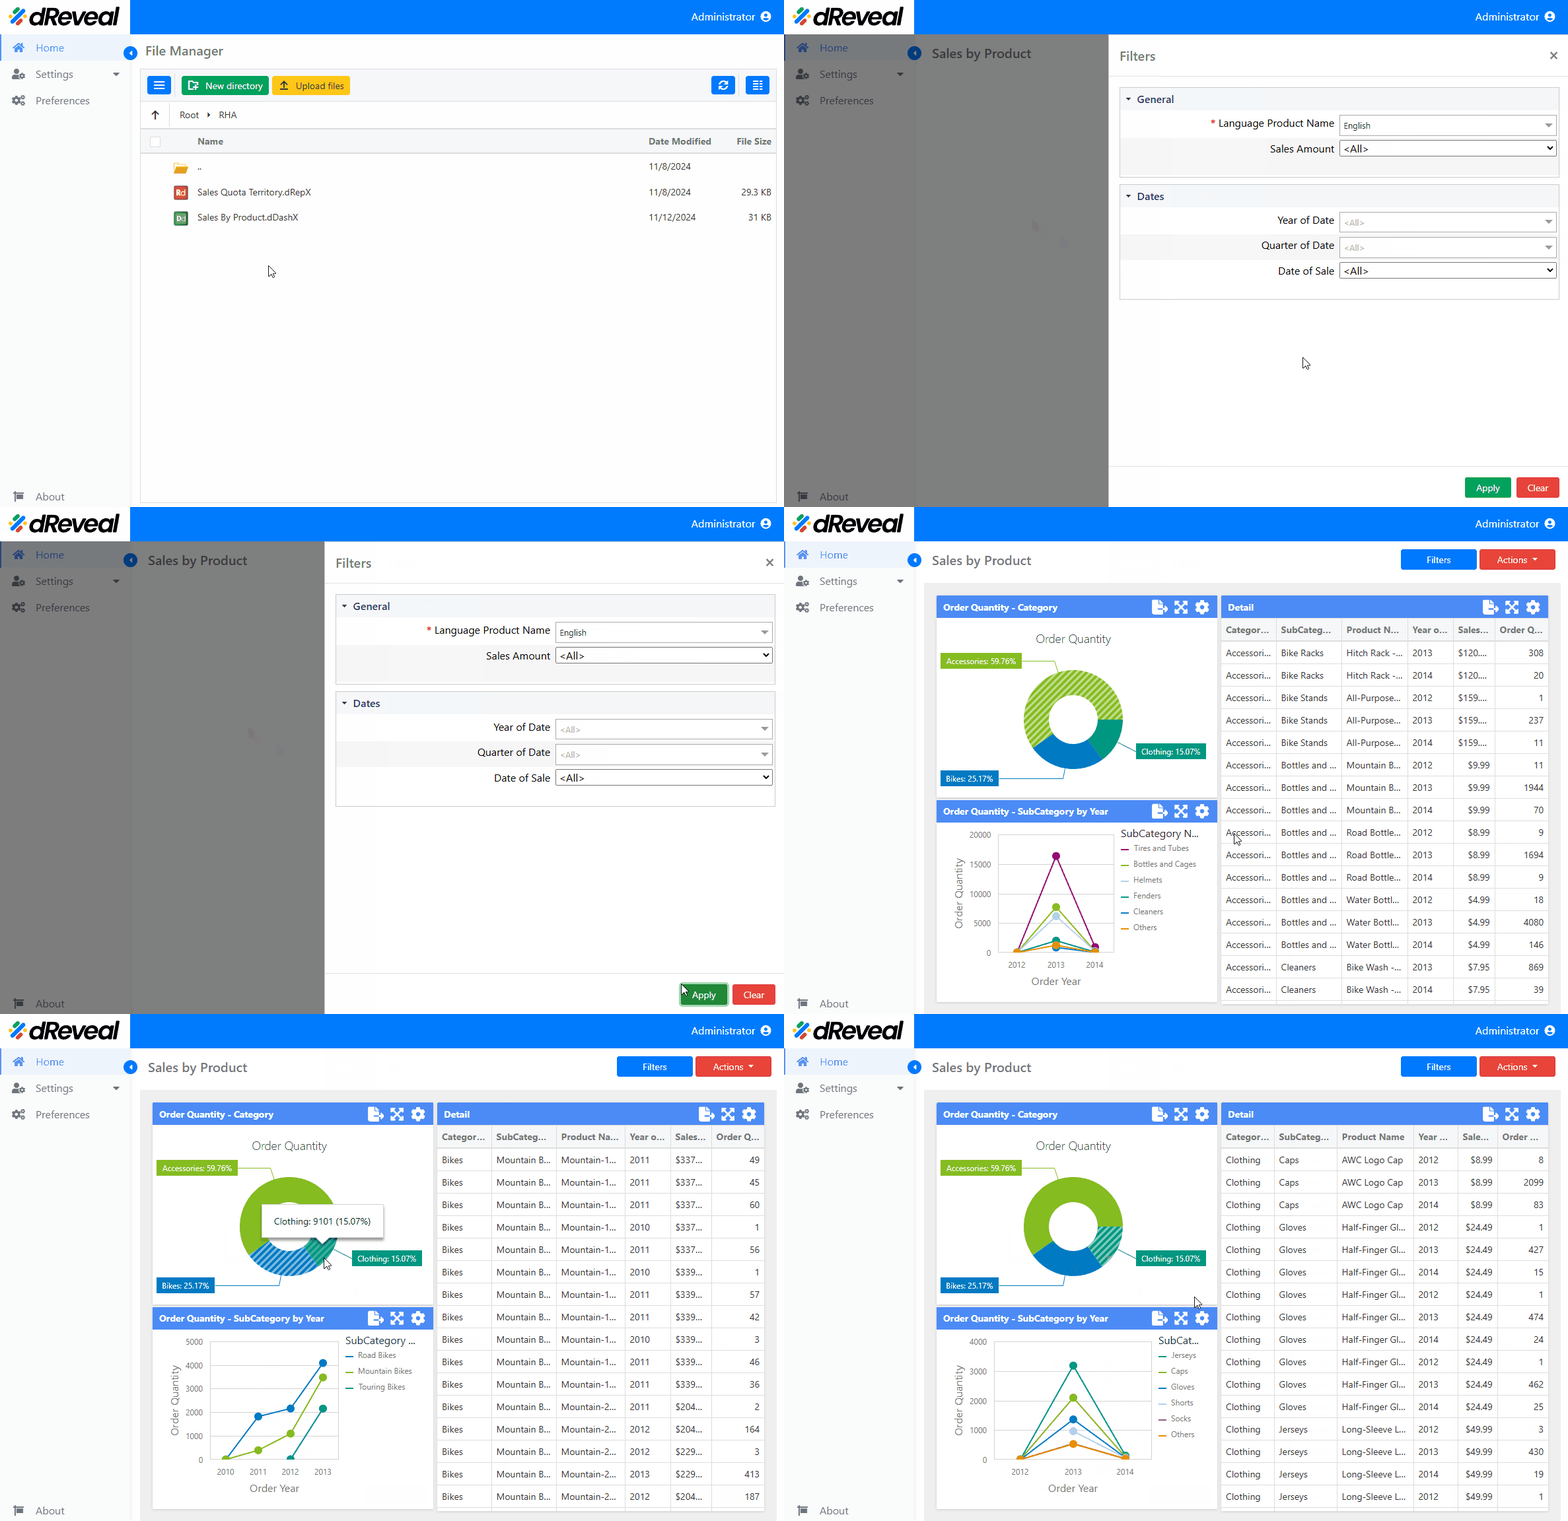
The Master Filter is a feature that allows you to apply a global filter to a set of visualizations within a dashboard. By selecting a value in a chart, it becomes the filter criterion for all other connected visualizations. This functionality can be applied to the following types of charts: Grid, Bar, Line, Scatter, Pies, Gauges, Cards, Treemap.
How to Select Master Filter
To select the Master Filter, first enter your username and password, then click the Login button. Once logged in, navigate to the report you wish to execute and double-click on it to open. Next, click the Apply button to display the report. Once the report is loaded, click on a value in the chart that has been configured as the Master Filter. This will apply the selected filter to all connected visualizations in the dashboard.