Change Values in X/Y Axes and Series
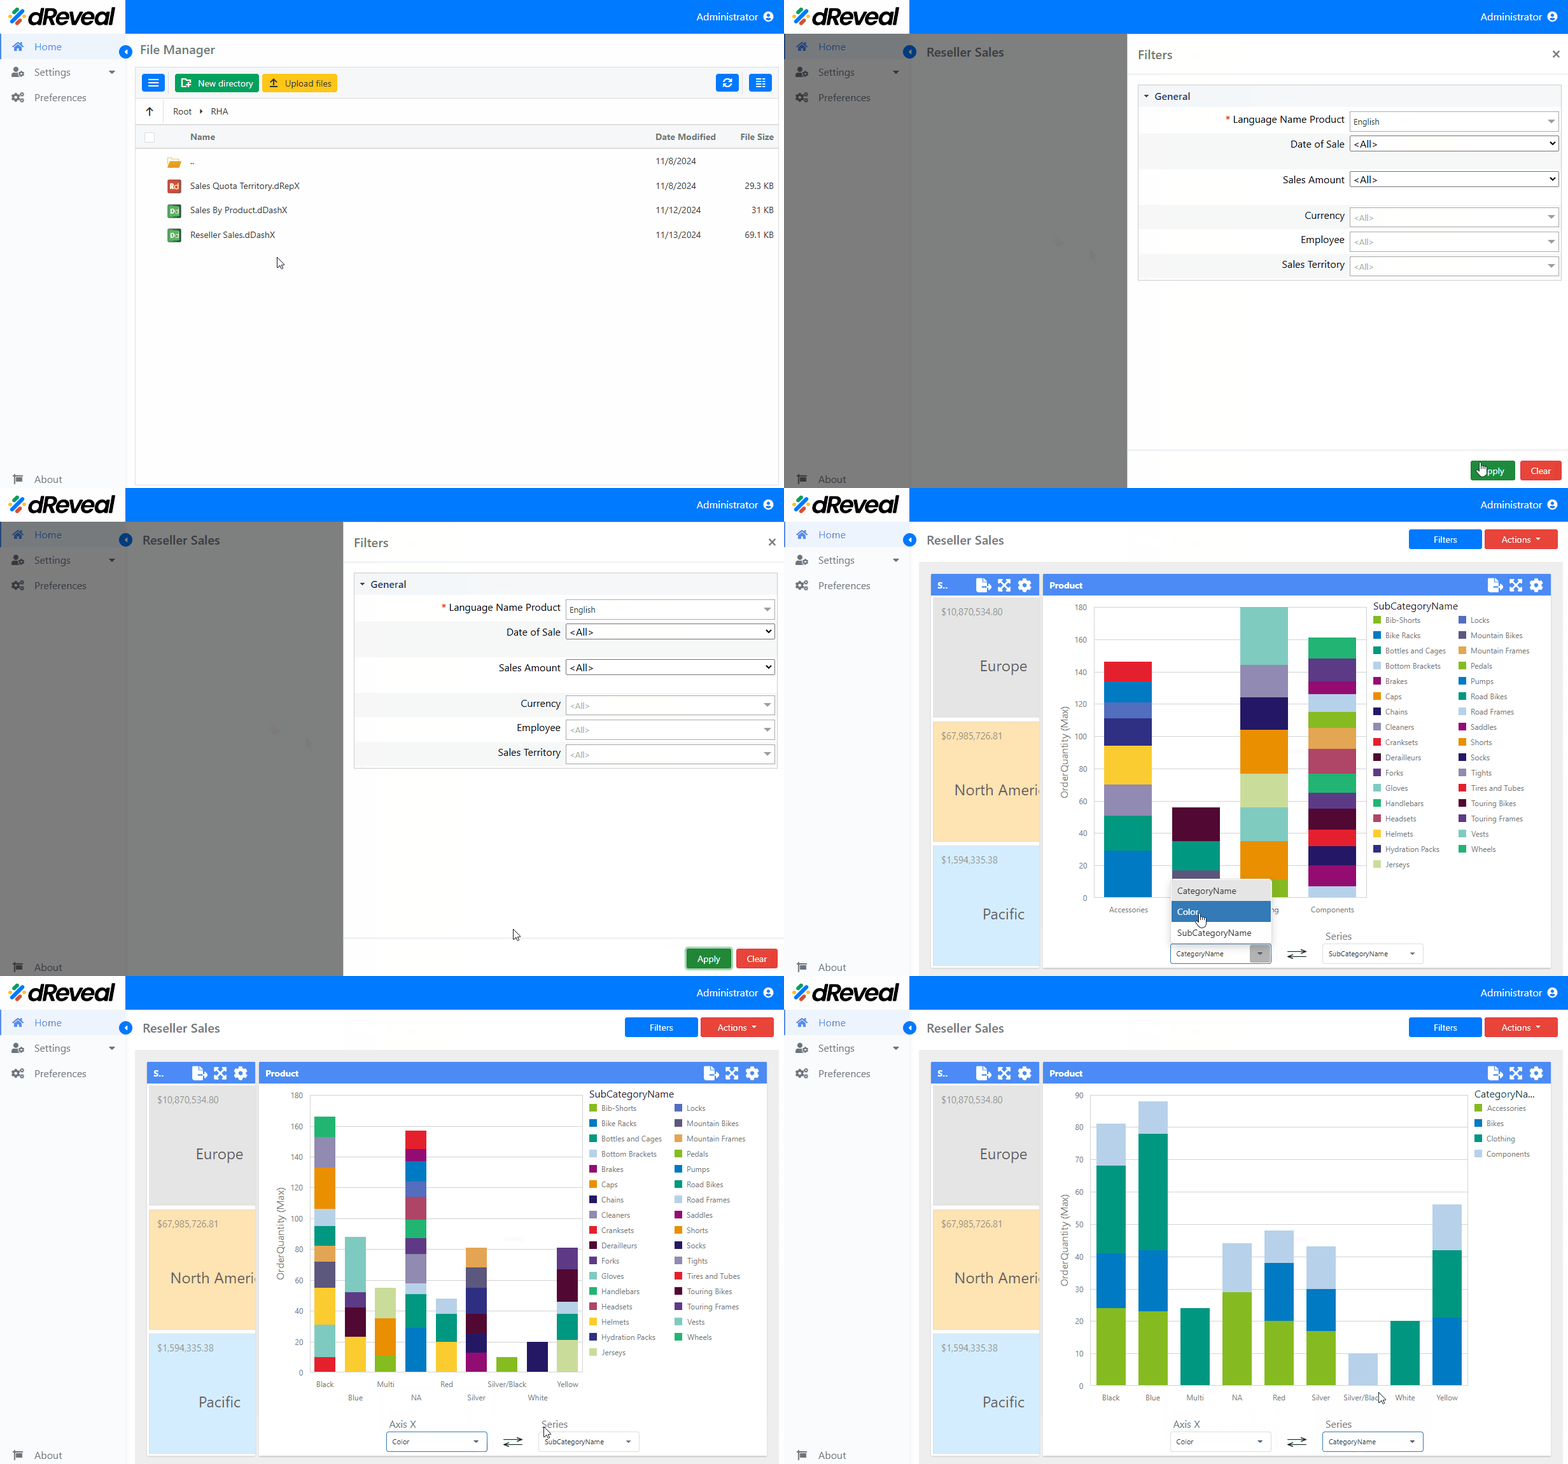
The Change Values in X/Y Axes and Series option allows users to select different values to display on the "X/Y Axes" and "Series" of a chart. This functionality provides flexibility for analyzing information from different perspectives, adapting the chart to the user's specific needs.
How to Change the Values in the X/Y Axes or Series
To change the values in the X/Y axes and the Series of a chart, first enter your username and password, then click the Login button. Once logged in, navigate to the report you wish to run and double-click on it to open. Next, click the Apply button to display the report. Once the report is loaded, click on the dropdown for the X/Y axes or Series and select a different value from the list. The chart will automatically update to show the data based on the selected value in the X/Y axes or Series.

