dReveal v4.2.2: What's New?
We're excited to announce the release of dReveal v4.2.2, packed with new features and enhancements that empower you to create even more powerful and insightful reports. This update brings greater flexibility, improved performance, and a more user-friendly experience for both report designers and end users.
Enhanced SQL Readability with Clean Columns
dReveal v4.2.2 introduces the Clean Columns feature, designed to improve the clarity and conciseness of your final SQL statements. This feature enables you to:
- Reduce SQL Size: Clean Columns minimizes the size of your SQL queries by eliminating unnecessary columns from the select statement, resulting in improved readability and potentially faster execution.
- Granular Control: Leverage granular control over Clean Columns. Configure it at various levels:
- Model Designer: Apply Clean Columns to specific reports for targeted optimization.
- Integration Level (Programmatically): Enable or disable Clean Columns during report execution through your hosting application. This allows for programmatic control over the feature based on specific reporting needs.
- Server Level: Establish a global setting for Clean Columns at the server level.
Dashboard: Pivot Chart Power-Ups
dReveal v4.2.2 injects a boost of interactivity into your Pivot Charts with a set of powerful new features:
Resizing Columns
Gain greater control over data presentation by resizing columns within your Pivot Charts. The text in the left column will adjust to fit the column width, displaying ellipses (...) for text that overflows.
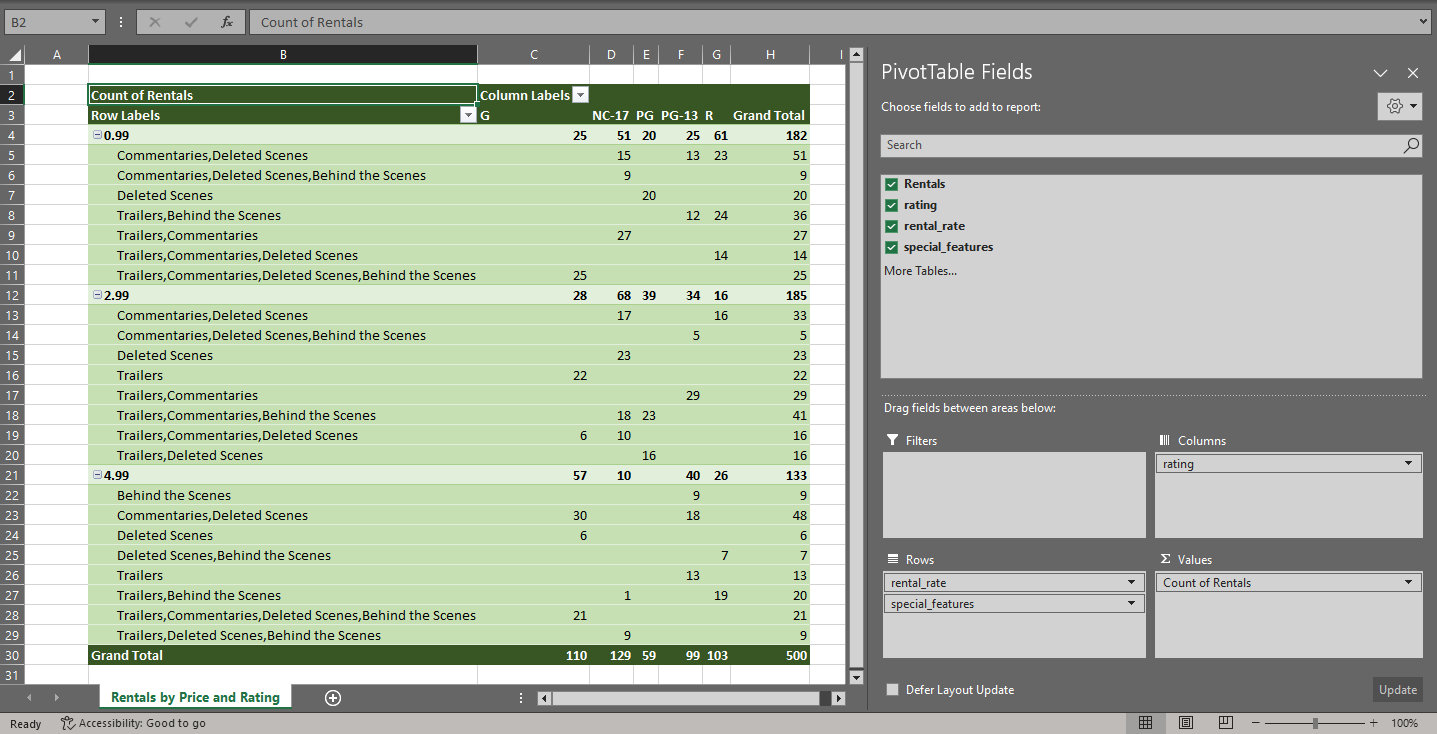
Export to Excel
Effortlessly export Pivot Charts directly as native Excel pivot tables for further analysis or sharing. As shown in the image below, the exported Pivot Chart transforms into a fully functional Pivot Table in Excel, allowing you to leverage all of Excel's powerful data manipulation capabilities.
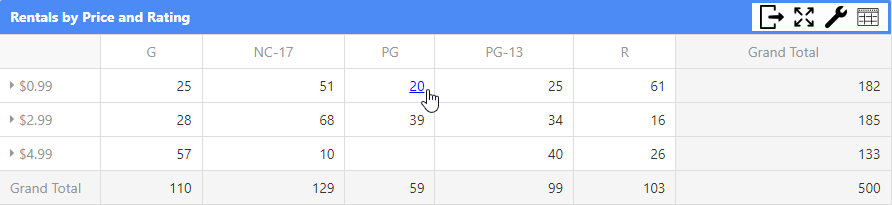
Drill Through
Pivot Charts now support drill-through functionality, allowing you to dive deeper into your data directly from the charts.
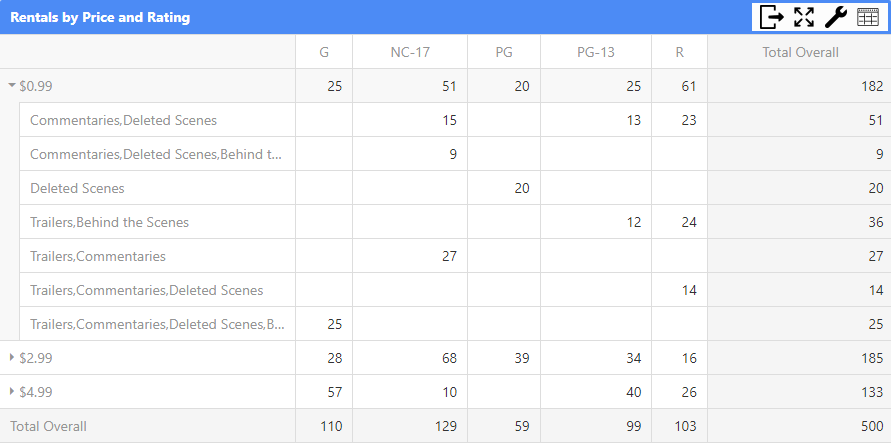
Customizable Labels
Enhance clarity and communication by modifying labels in totals and subtotals. For example, as shown in the image below, the 'Grand Total' label has been changed to 'Total Overall,' and the subtotal labels have been removed from each grouping.
Desktop Designer: Streamlined Efficiency
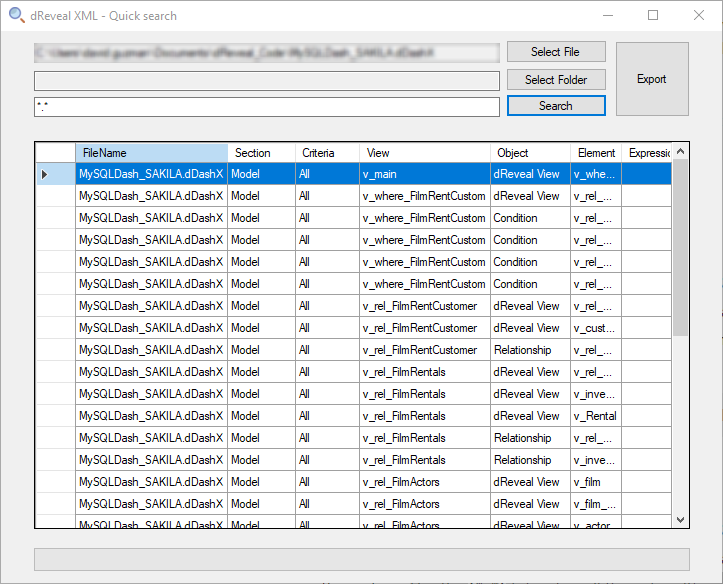
Quick Search
Easily locate objects within the Desktop Launcher using the new Quick Search functionality, available directly from the dReveal launcher. Select a dReveal file or a folder to search for a specific view, name, or any other criteria. Quickly find the information you need within the dReveal structure.
Use the *.* token to pull the entire dReveal file structure, allowing you to quickly find the information you need.
Jump to Definition
Jump directly to the definition of any element within the View Model for faster navigation and understanding.
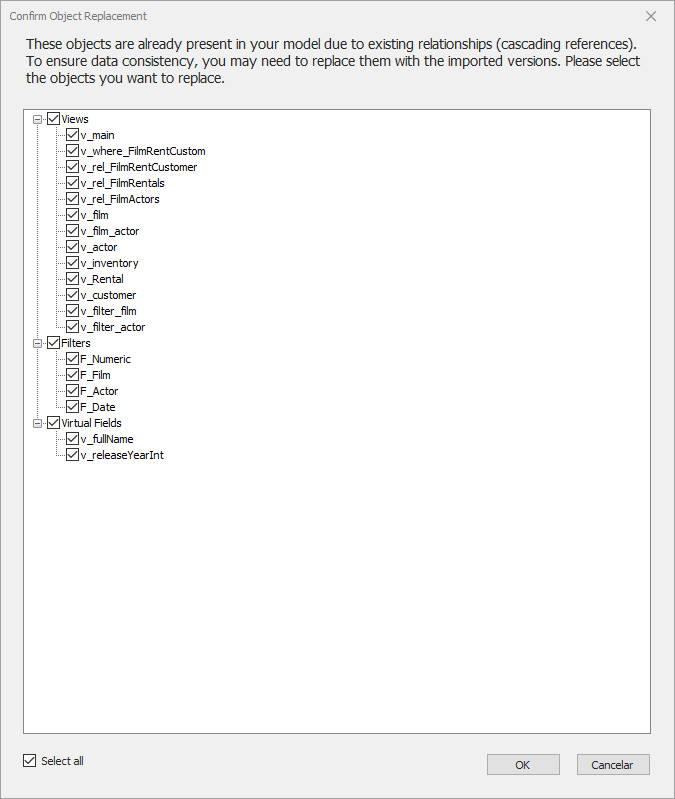
Import Objects Enhanced UI
Say goodbye to annoying confirmations when importing existing objects into your model. The new UI provides an improved way to confirm replacements, allowing you to indetify all existing objects 'all at once' instead of being prompted multiple times for each object within your model.
Dashboard Chart Enhancements
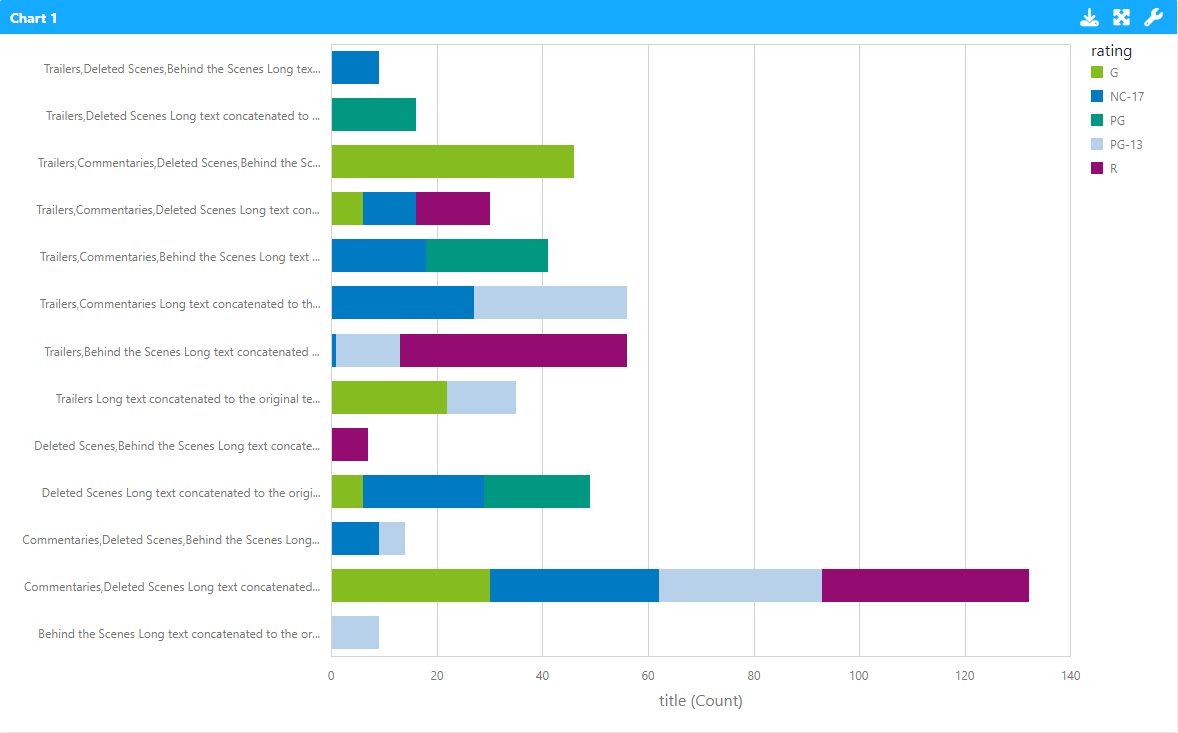
Legend and Axis Size Control with Truncation
Enhance your dashboard charts by managing the size of legends and axes, ensuring a cleaner presentation and optimized focus on the data.
Long text in legends and axes will now be truncated with an ellipsis (...) to reduce clutter and improve readability. By default, charts will display the entire label, but this can be configured to limit the size. This truncation only affects the display value; the full text will still be shown in tooltips and when exporting to Excel.
In the image below, notice how the labels in the chart are displayed with ellipses (...), allowing for better use of space and greater focus on the bars.
Enhanced Automation Testing with Expanded Chart Support
dReveal v4.2.2 empowers you to streamline your automated testing processes with the addition of new chart type support within the DataExtractionAPI.
This update expands your capabilities by enabling verification of:
- Grid Charts
- Pivot Tables
- Card Charts
Expanded Datasource Support: Welcome MySQL!
dReveal v4.2.2 now supports MySQL, expanding your data source options. You can now create reports using data from the widely-used MySQL database platform. This integration is available both in the DLLs and in the desktop designers, making it easier than ever to connect, design, and generate reports with your MySQL data. Enjoy seamless access to your MySQL databases and enhance your reporting capabilities with dReveal.
Grid Merged Cells: Streamlined Usability
Removing Column Grouping when Merged Cells
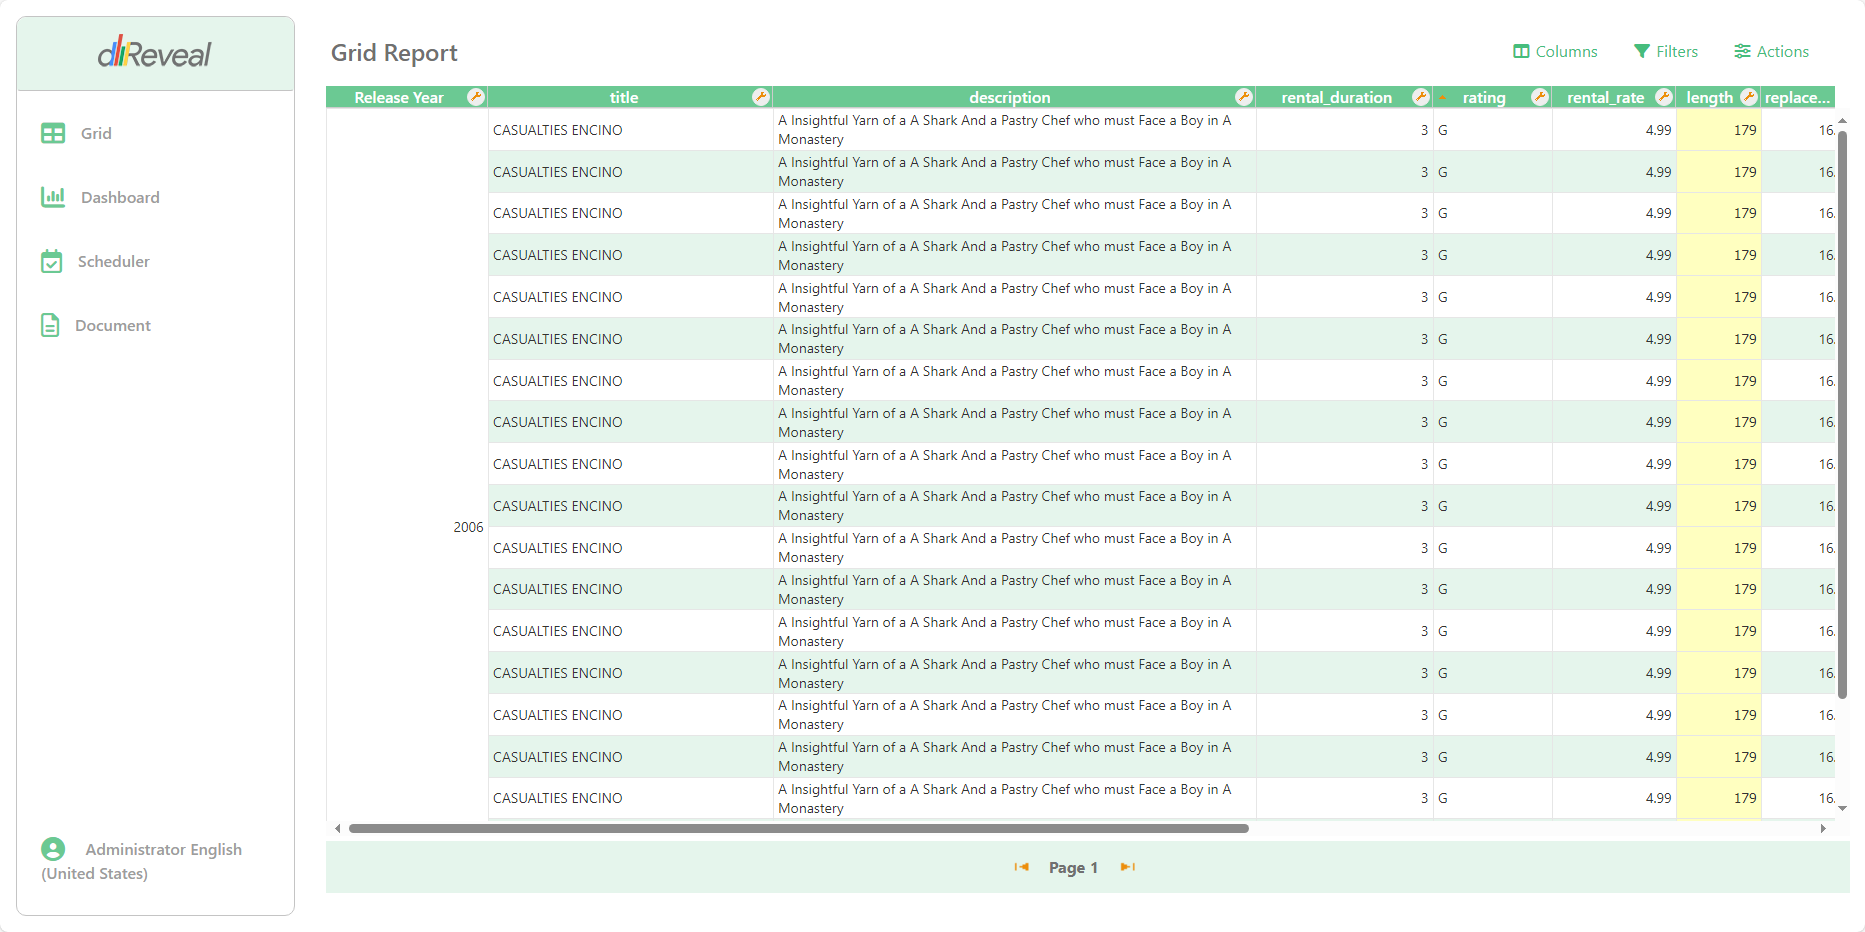
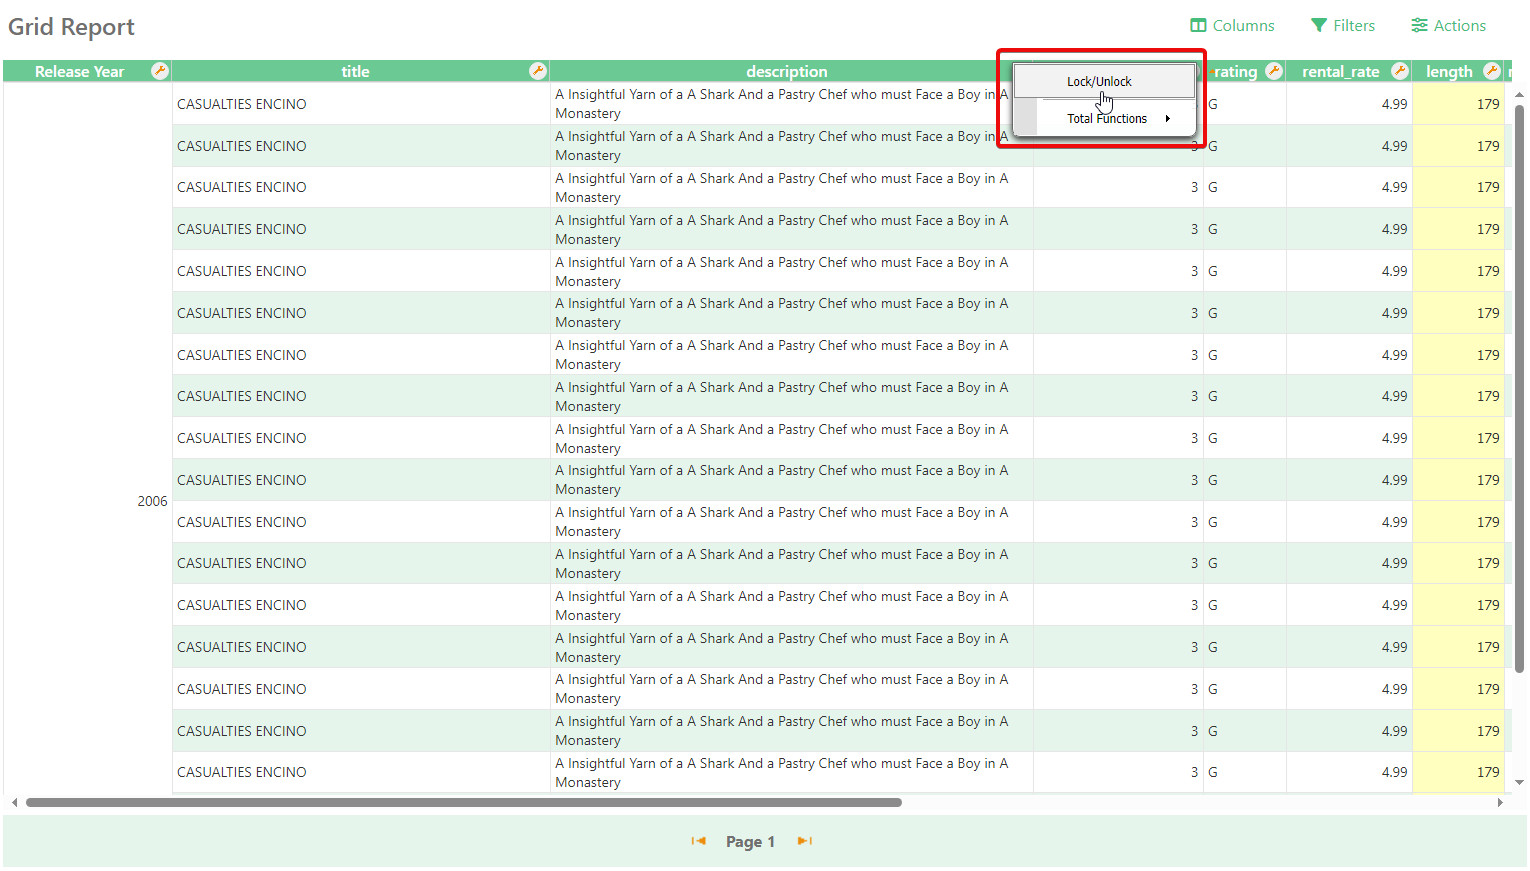
When cells are merged in a grid, the column grouping feature can become unnecessary or confusing. To address this, the column grouping area is now automatically removed when merged cells are present. This change enhances usability by ensuring a cleaner, more intuitive interface for end-users. As shown in the image below, there is no area to drag and drop columns.
Improved Column Sorting Options
When defining a grid report, particularly when configuring merged cells, the report designer now offers the option to disable column sorting. This allows end-users to either maintain the report's original state.
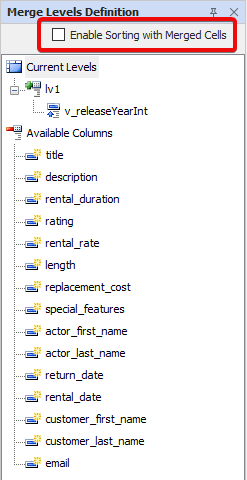
In the grid designer, under the merge cell configuration, you will find a new property to enable or disable the sorting options for columns. This feature is enabled by default.
Integration Changes
Stay tuned for further details on integration changes within dReveal v4.2.2. We'll provide a separate update outlining these modifications.
We believe these new features and enhancements in dReveal v4.2.2 will significantly empower you to create and deliver insightful reports with greater efficiency and flexibility. Get ready to experience the next level of reporting power!