Grouping
Organize your data intelligently with dReveal groups. By grouping your data, you can simplify the visualization and analysis of large datasets. This feature allows you to:
Improve understanding: Present your data more clearly and concisely, making it easier to interpret.
Speed up analysis: Quickly filter and explore the data that matters most to you, saving you time and effort.
Customize your view: Create custom groups that cater to your specific analysis needs.
Key Advantages:
-
Eases Navigation: By grouping related rows or columns, you can collapse or expand entire groups as needed, making it easier to navigate your data and reducing visual clutter in the spreadsheet.
-
Efficient Analysis: Allows you to focus on specific sections of your data without being distracted by information that is not relevant at the time. This is useful for detailed analysis and review of information.
-
Logical Structuring: Helps you establish a logical and organized structure in your data, which is crucial for reporting or preparing analyses that require a clear separation of sections.
-
Error Reduction: By working with grouped data, you reduce the possibility of errors when manipulating information, as you can avoid accidental changes to unwanted parts of the spreadsheet.
-
Clear and Concise Presentation: Facilitates the creation of clearer and more concise reports and presentations by allowing you to show or hide details according to the need of the audience or context.
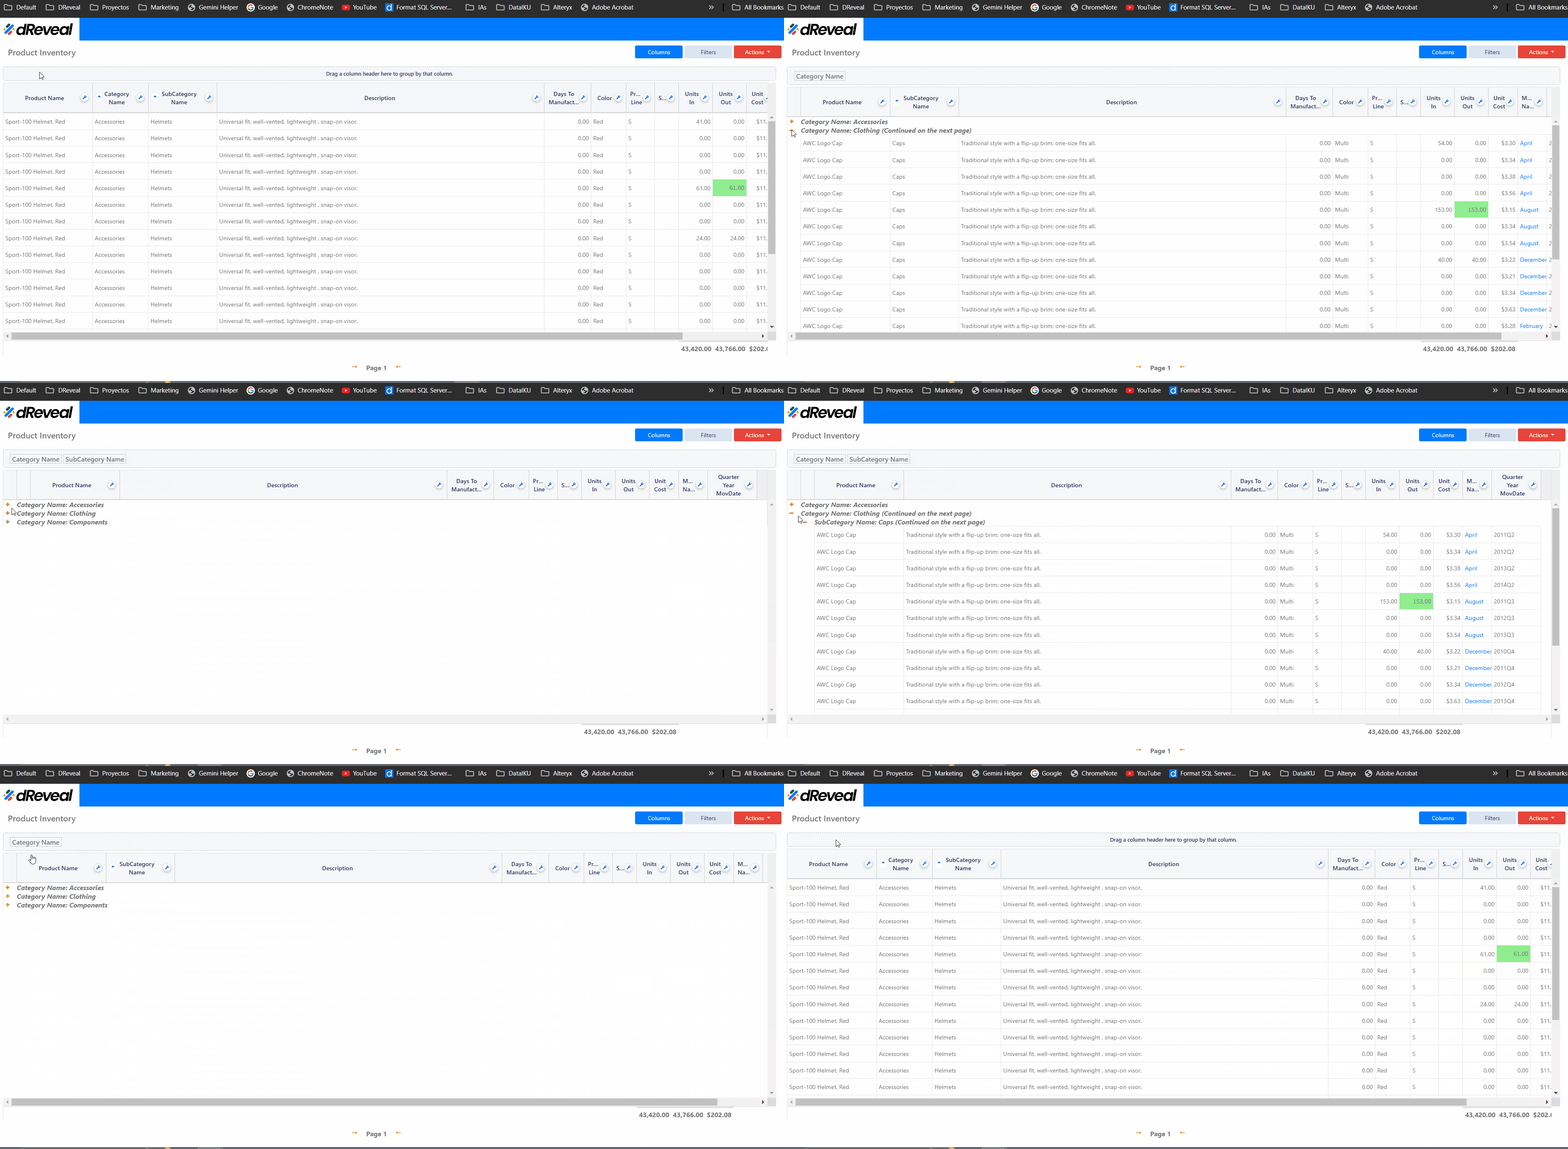
To create a group hierarchy in dReveal, simply drag the column name to the area above the column titles row (as shown in the image below).
The first column you drag will become your first level of grouping.
To remove a grouped column, drag it from the grouping area back to the column titles row.
Preview

