Change Values in X/Y Axes and Series
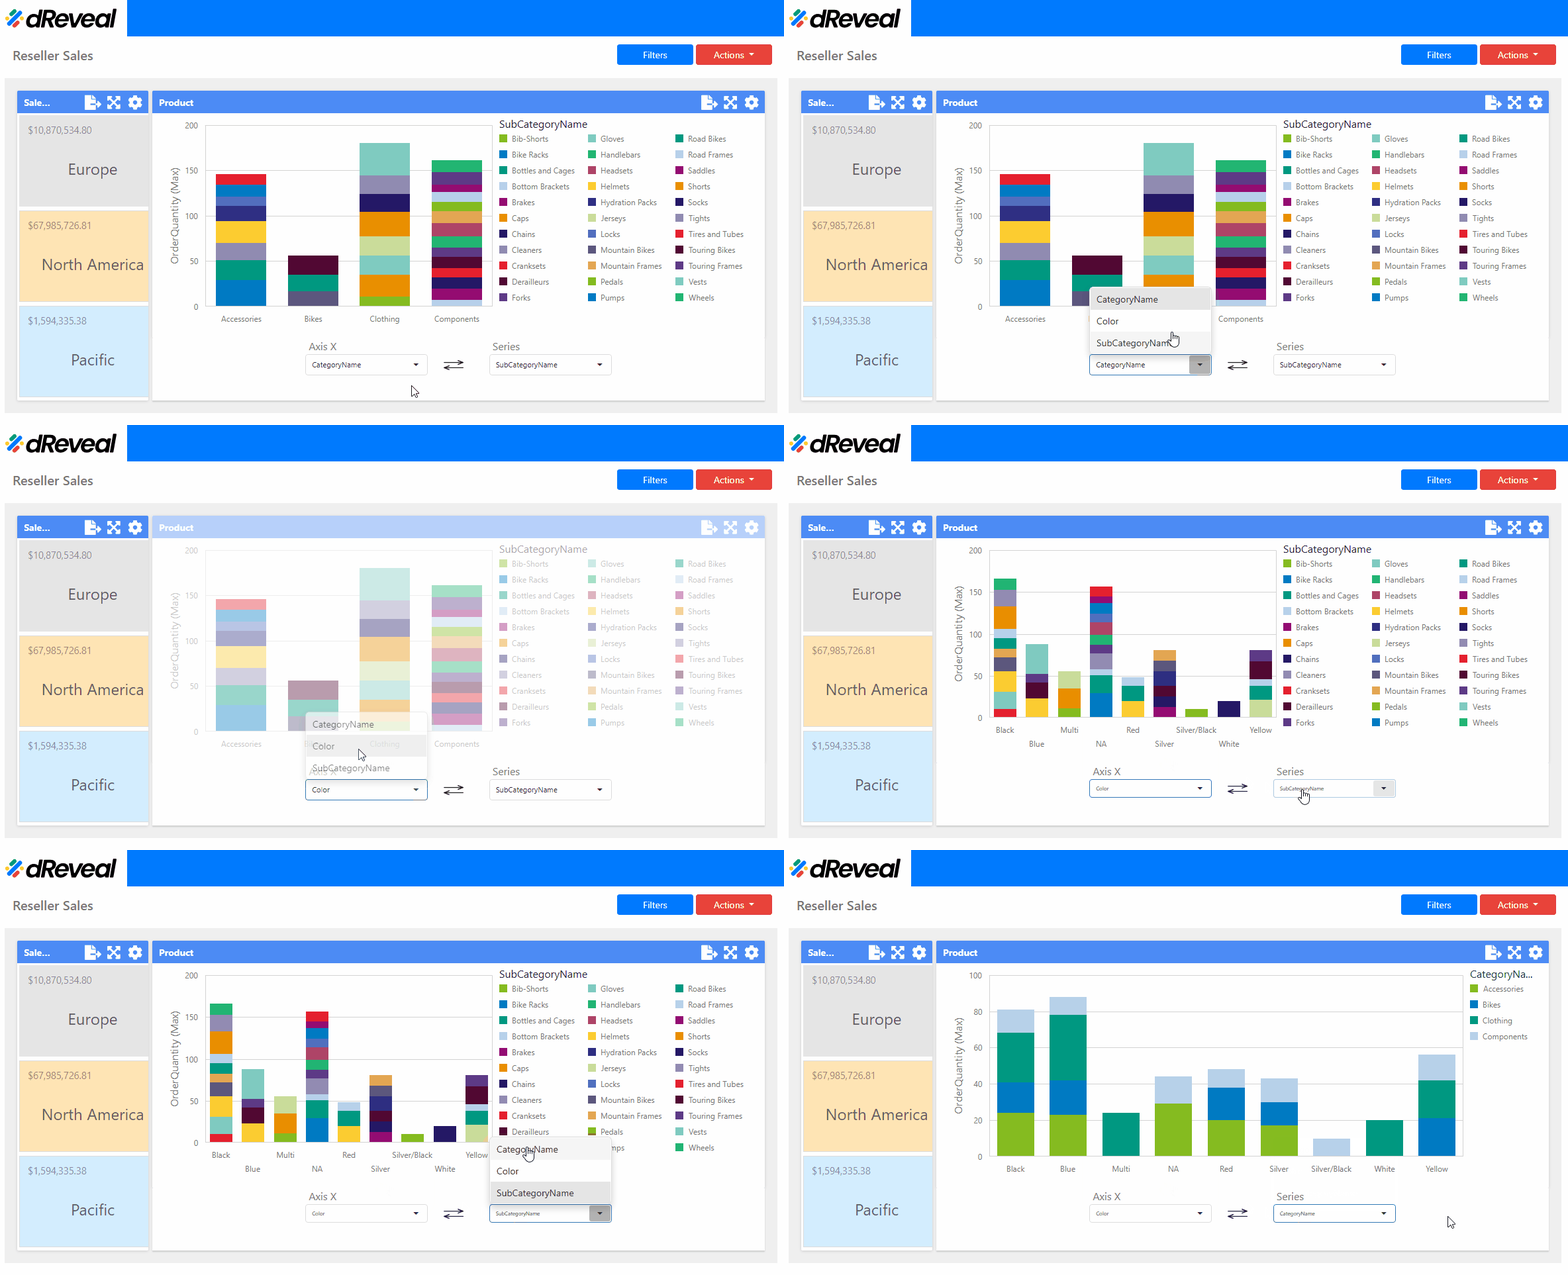
The option to Change values in X/Y Axes and Series in a dashboard report allows users to modify the arrangement of data in the charts by switching the positions of the axes and the series. This functionality provides greater flexibility to explore and analyze data from various perspectives, adjusting the visualization to the specific needs of each user.
How to Change the Values in the X/Y Axes or Series
To change the values in the X/Y axes and the Series of a chart, first make sure you have the report you want to execute. Then, open your web browser, either Google Chrome or Microsoft Edge. Next, select the Report and drag it into the browser, dropping it in the browser window. Once the report has loaded, click the Apply button to display the report. Then, click on the dropdown for the X/Y axes or Series and select a different value from the list. The chart will automatically update to show the data based on the selected value in the Axes or Series.

