Scatter Chart
dReveal simplifies the creation of detailed reports thanks to its intuitive Dashboard Designer. With this tool, you can generate dynamic charts that allow you to quickly and easily gain valuable insights from your data. The ability to customize reports helps you discover opportunities and make more informed decisions. Additionally, you can share your findings with other users through interactive reports.
How to Create a Scatter Chart:
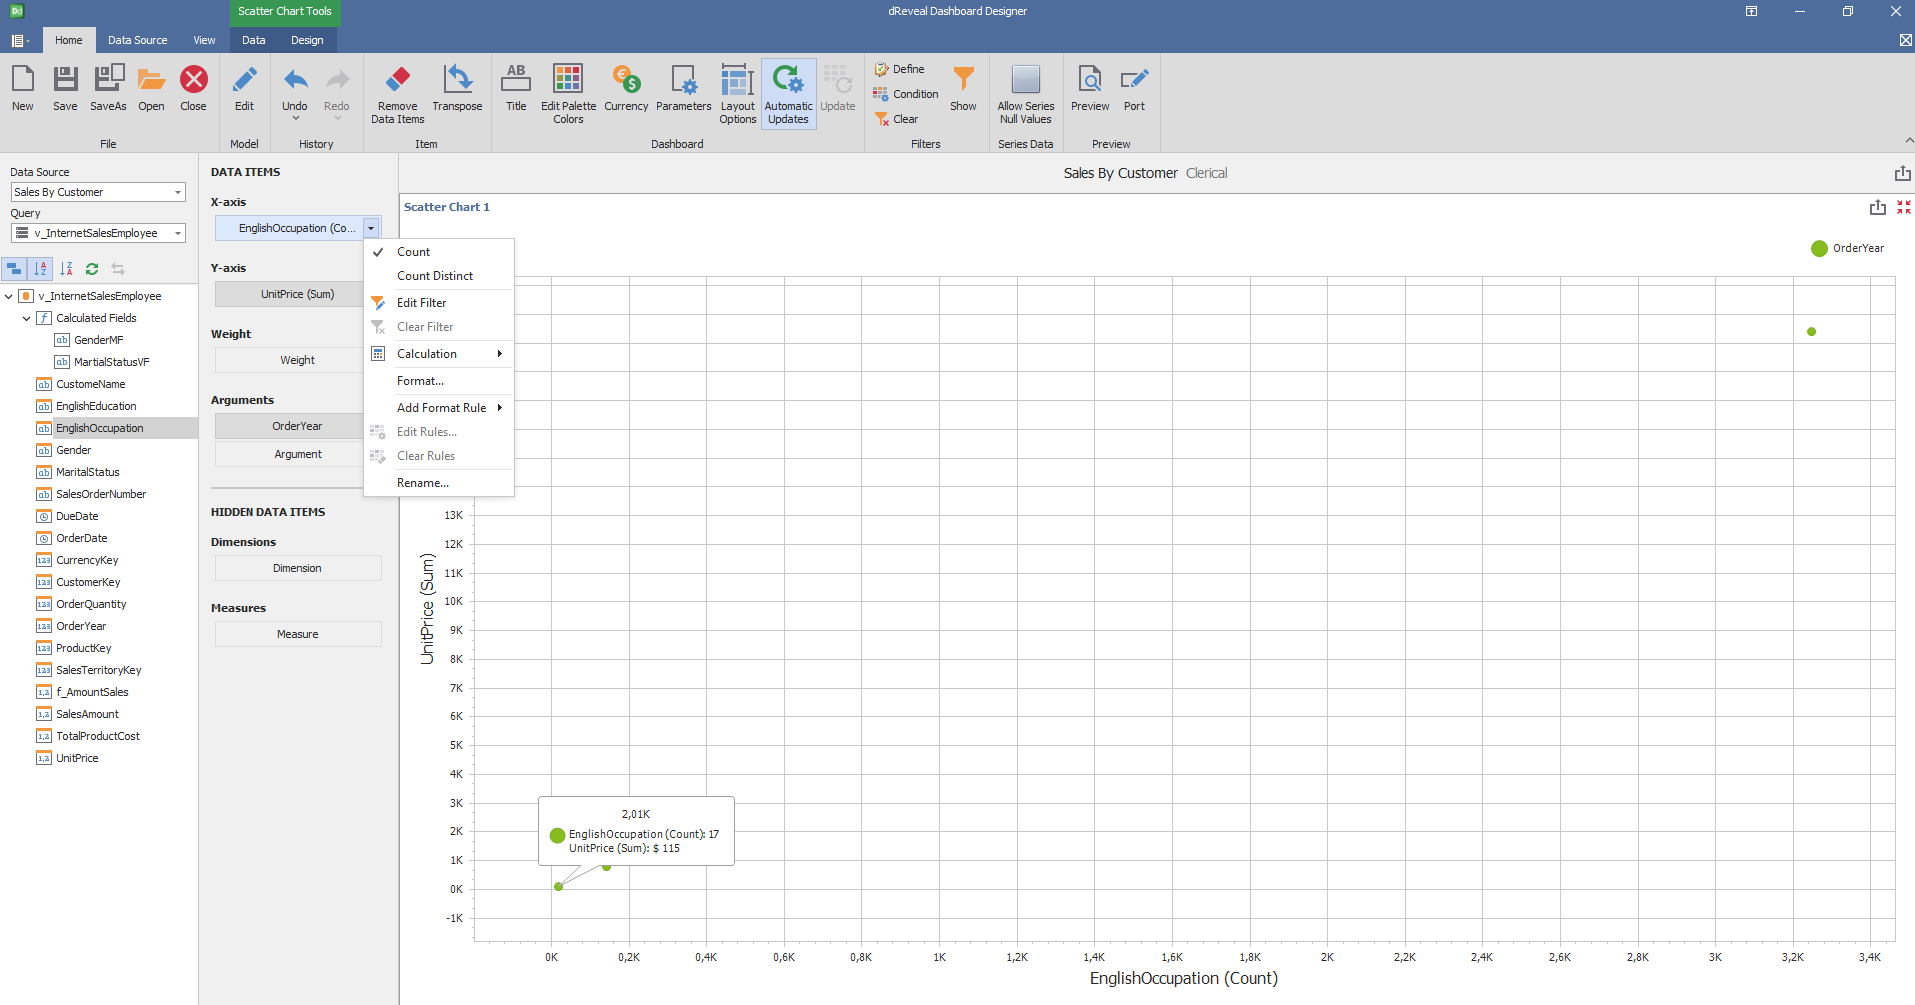
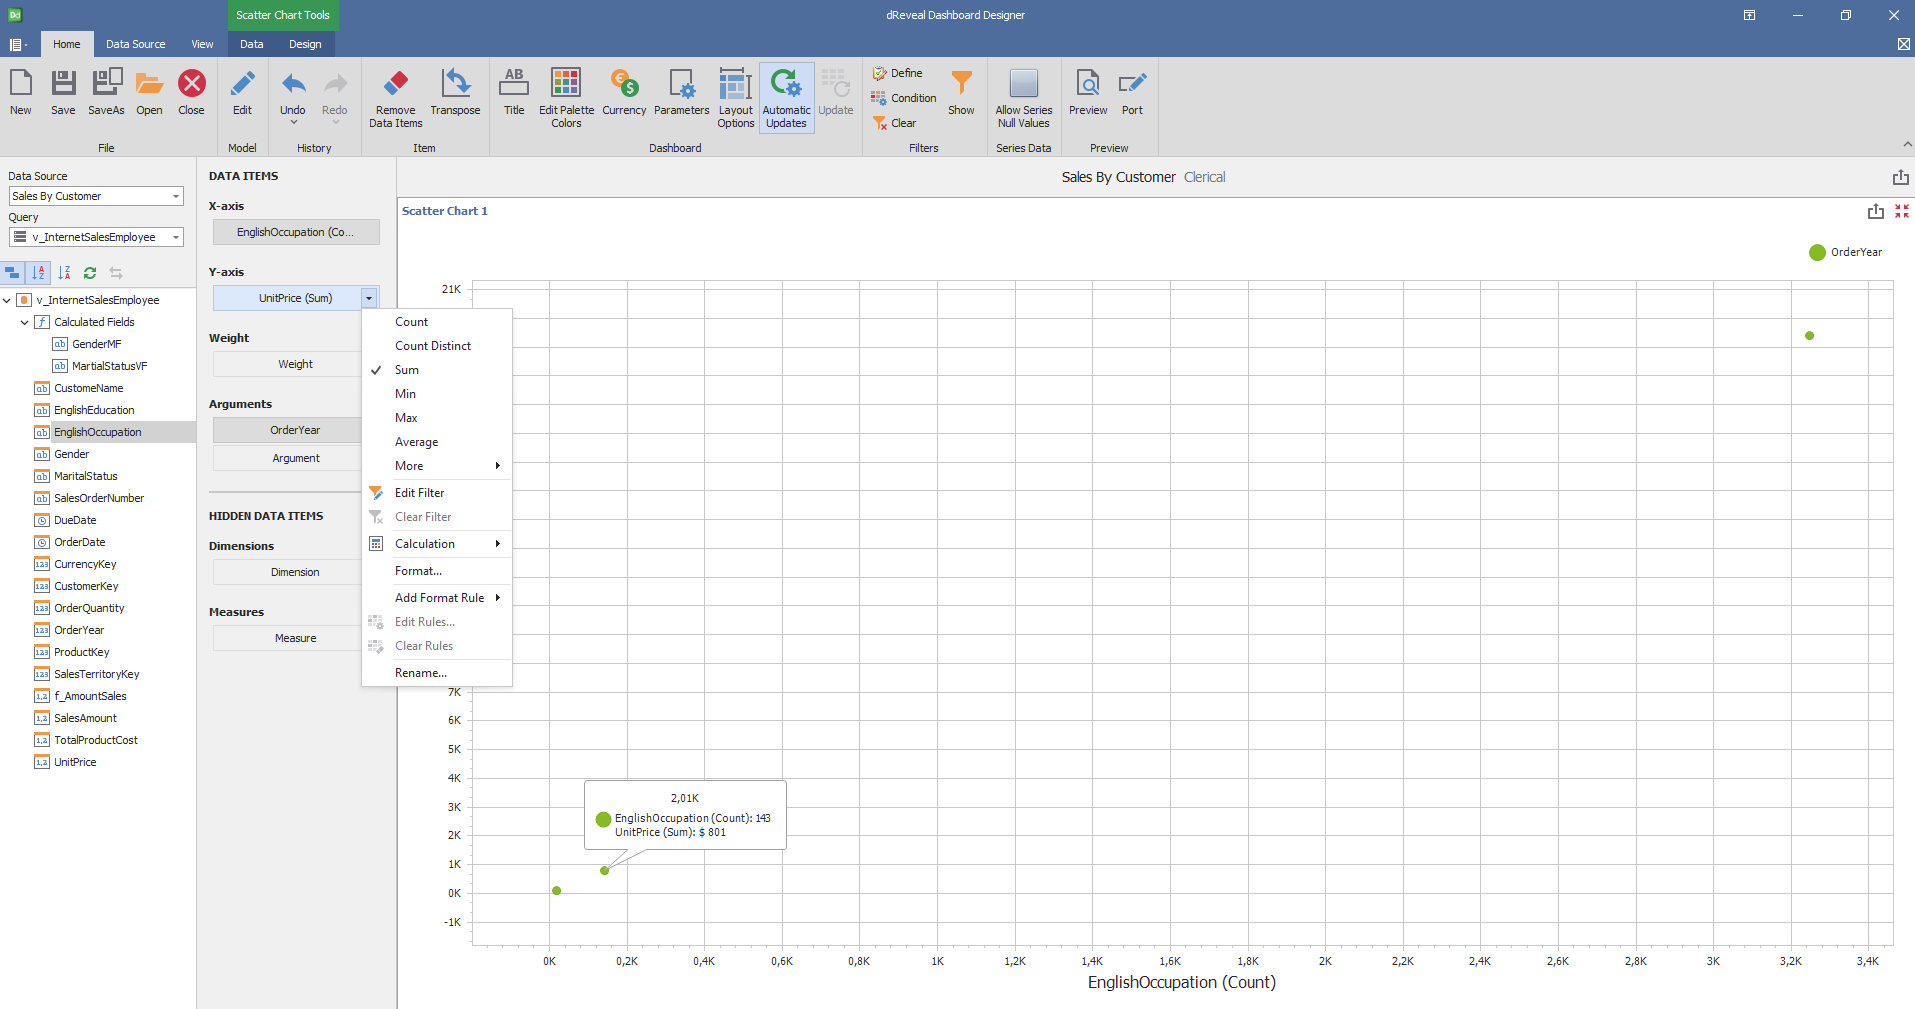
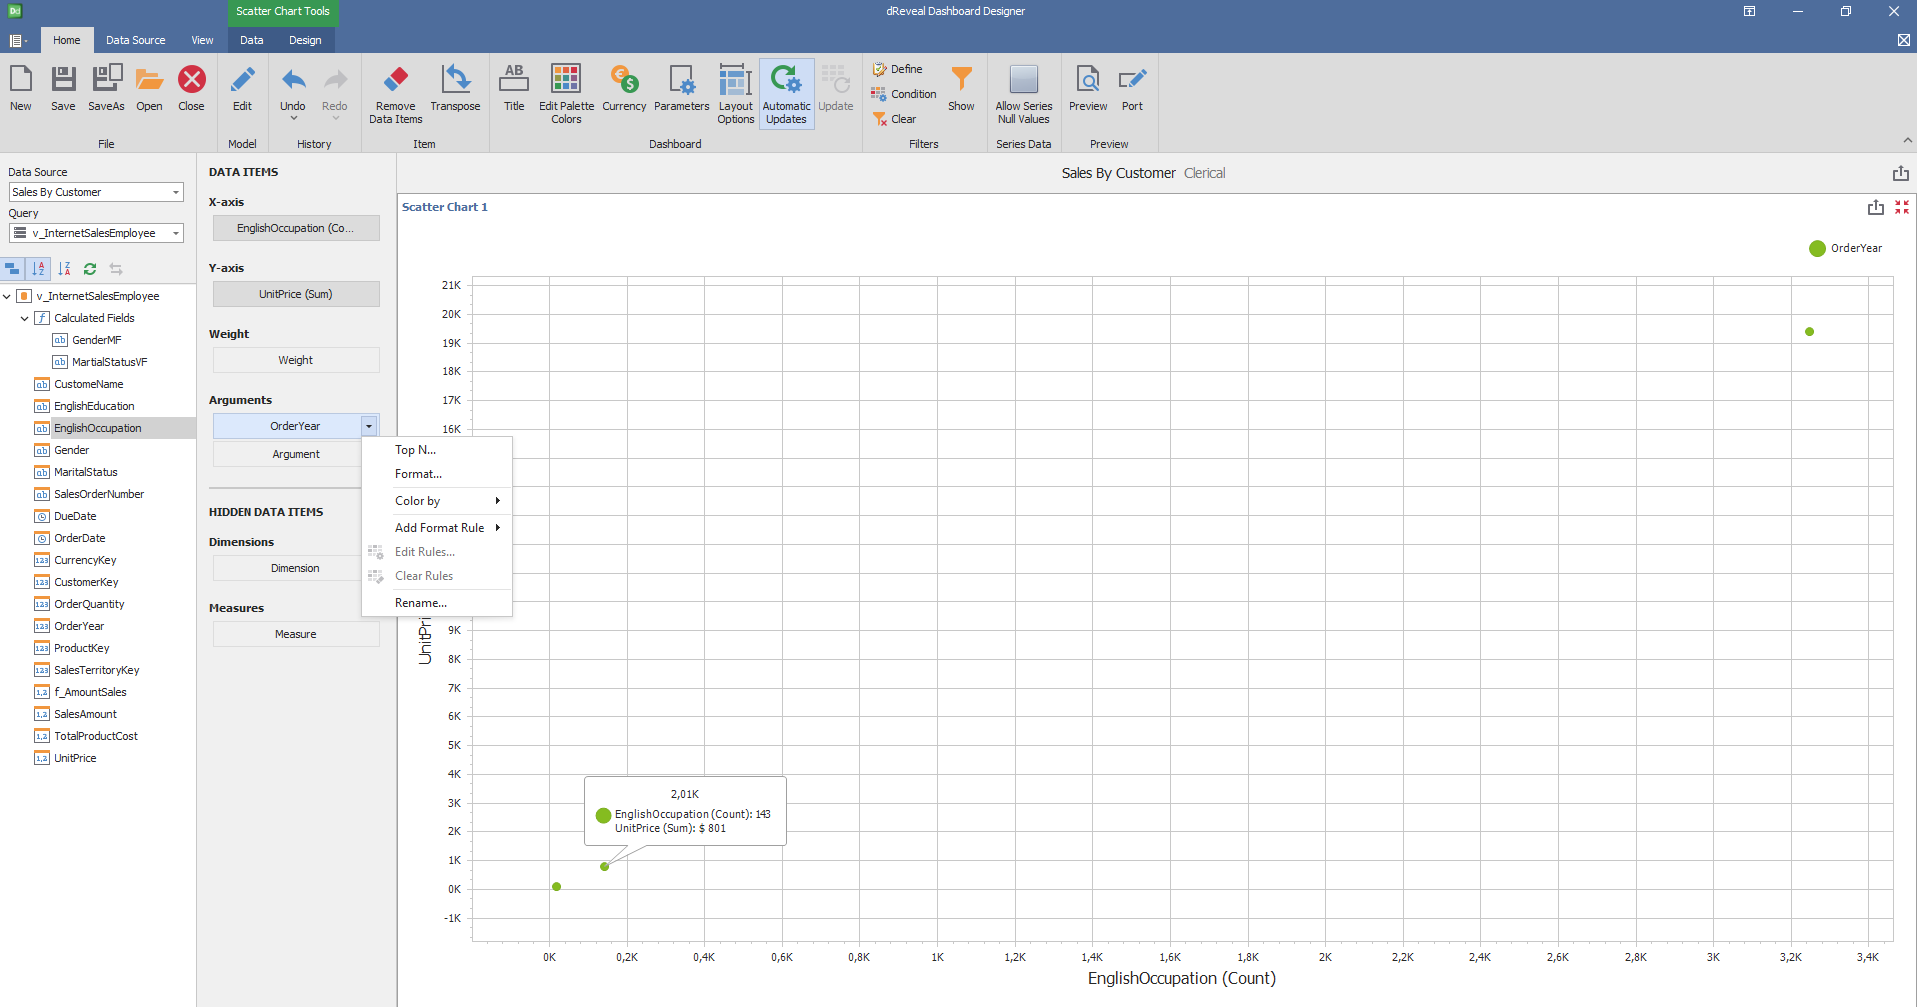
To start visualizing your data in a scatter plot, open the Dashboard Designer. You can start a new project or work on an existing one. Once inside, select the "Scatter Plot" icon. Then, drag and drop the variables you want to analyze from the main view to the "Columns" section under DATA ITEMS. This way, you can create a custom scatter plot that will allow you to identify relationships and patterns in your data.

Dashboard Designer also provides various options to customize the 'Scatter Chart' based on the data type displayed in each column. Below is a general overview of the different options you can apply to your Scatter Chart.
Column of type String

Column of type Numeric

Column of type Date:

Data
Fields
| Options | Description |
|---|---|
| X Fields | Specifies a criterion that defines what data should be displayed on the X axis of the chart. |
| Y Fields | Specifies a criterion that defines what data should be displayed on the Y axis of the chart. |
| DropDown Text label | Change the text above the selector. |
| Enable Swap | Activates the position exchange of definitions on the chart. |

Properties
| Options | Description |
|---|---|
| Drill Through | When you select the Drill Through element, a new window appears to indicate its properties. |

Design
'Scatter Chart' has a variety of options in the 'Design' tab to customize your chart. Next, we will show you the different options you can apply to your Scatter Chart.
Diagram
| Options | Description |
|---|---|
| Rotate | Rotate the diagram at 90º. |
| X-Axis Settings | Customize various X-Axis Settings, such as the visibility and Axis Title. |
| Y-Axis Settings | Customize various Y-Axis Settings, such as the visibility, title and displayed range. |

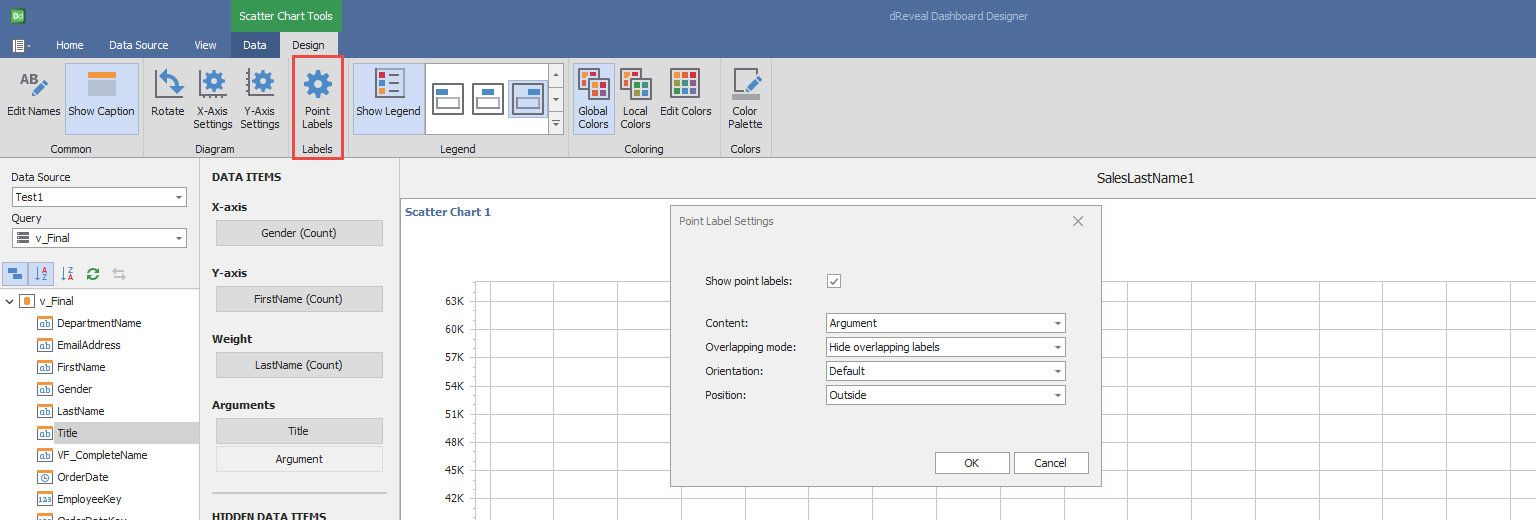
Point Labels
| Options | Description |
|---|---|
| Show point label | When activated, it displays the options in the point label setting. |
| Content | It allows demonstrating various options such as argument, weight, values, argument and weight, argument and value. |
| Overlapping mode | It allows you to display various label overlap options. |
| Orientation | This option allows me to rotate labels from left or right. |
| Position | This feature lets me position labels either internally or externally. |

Legend
| Options | Description |
|---|---|
| Show Legend | Show the legend that helps end-users identify chart elements. |

Coloring
| Options | Description |
|---|---|
| Global Colors | Use a global scheme to color elements of a dashboard item. |
| Local Colors | Use a local scheme to color elements of a dashboard item. |
| Edit Colors | Specify colors used to color elements of a dashboard item. |

Colors
| Options | Description |
|---|---|
| Color Palette | Add a custom background color. This graphing tool allows you to select a solid or soft gradient background color. By adjusting the color and transparency of the background, you can create a visual contrast that highlights the data and makes it easier to interpret. |

