Pivot Chart
The Dashboard Designer enables users to create highly customized interactive dashboards. By building dynamic visualizations, such as charts and tables, users can explore their data from multiple perspectives. This flexibility allows users to make more informed decisions by visualizing their data in an intuitive and adaptable way.
How to Create a Pivot Chart:
To delve deeper into your data analysis, start by creating a pivot table. Access the Panel Designer and select the "Pivot" icon. Drag the columns you want to compare from the main view to the DATA ITEMS section. You can customize the appearance of your pivot table by applying different formats to the numeric columns. Use filters to segment your data and focus on specific aspects of your analysis. If you need to perform custom calculations, you can create measures to obtain more detailed and relevant information.
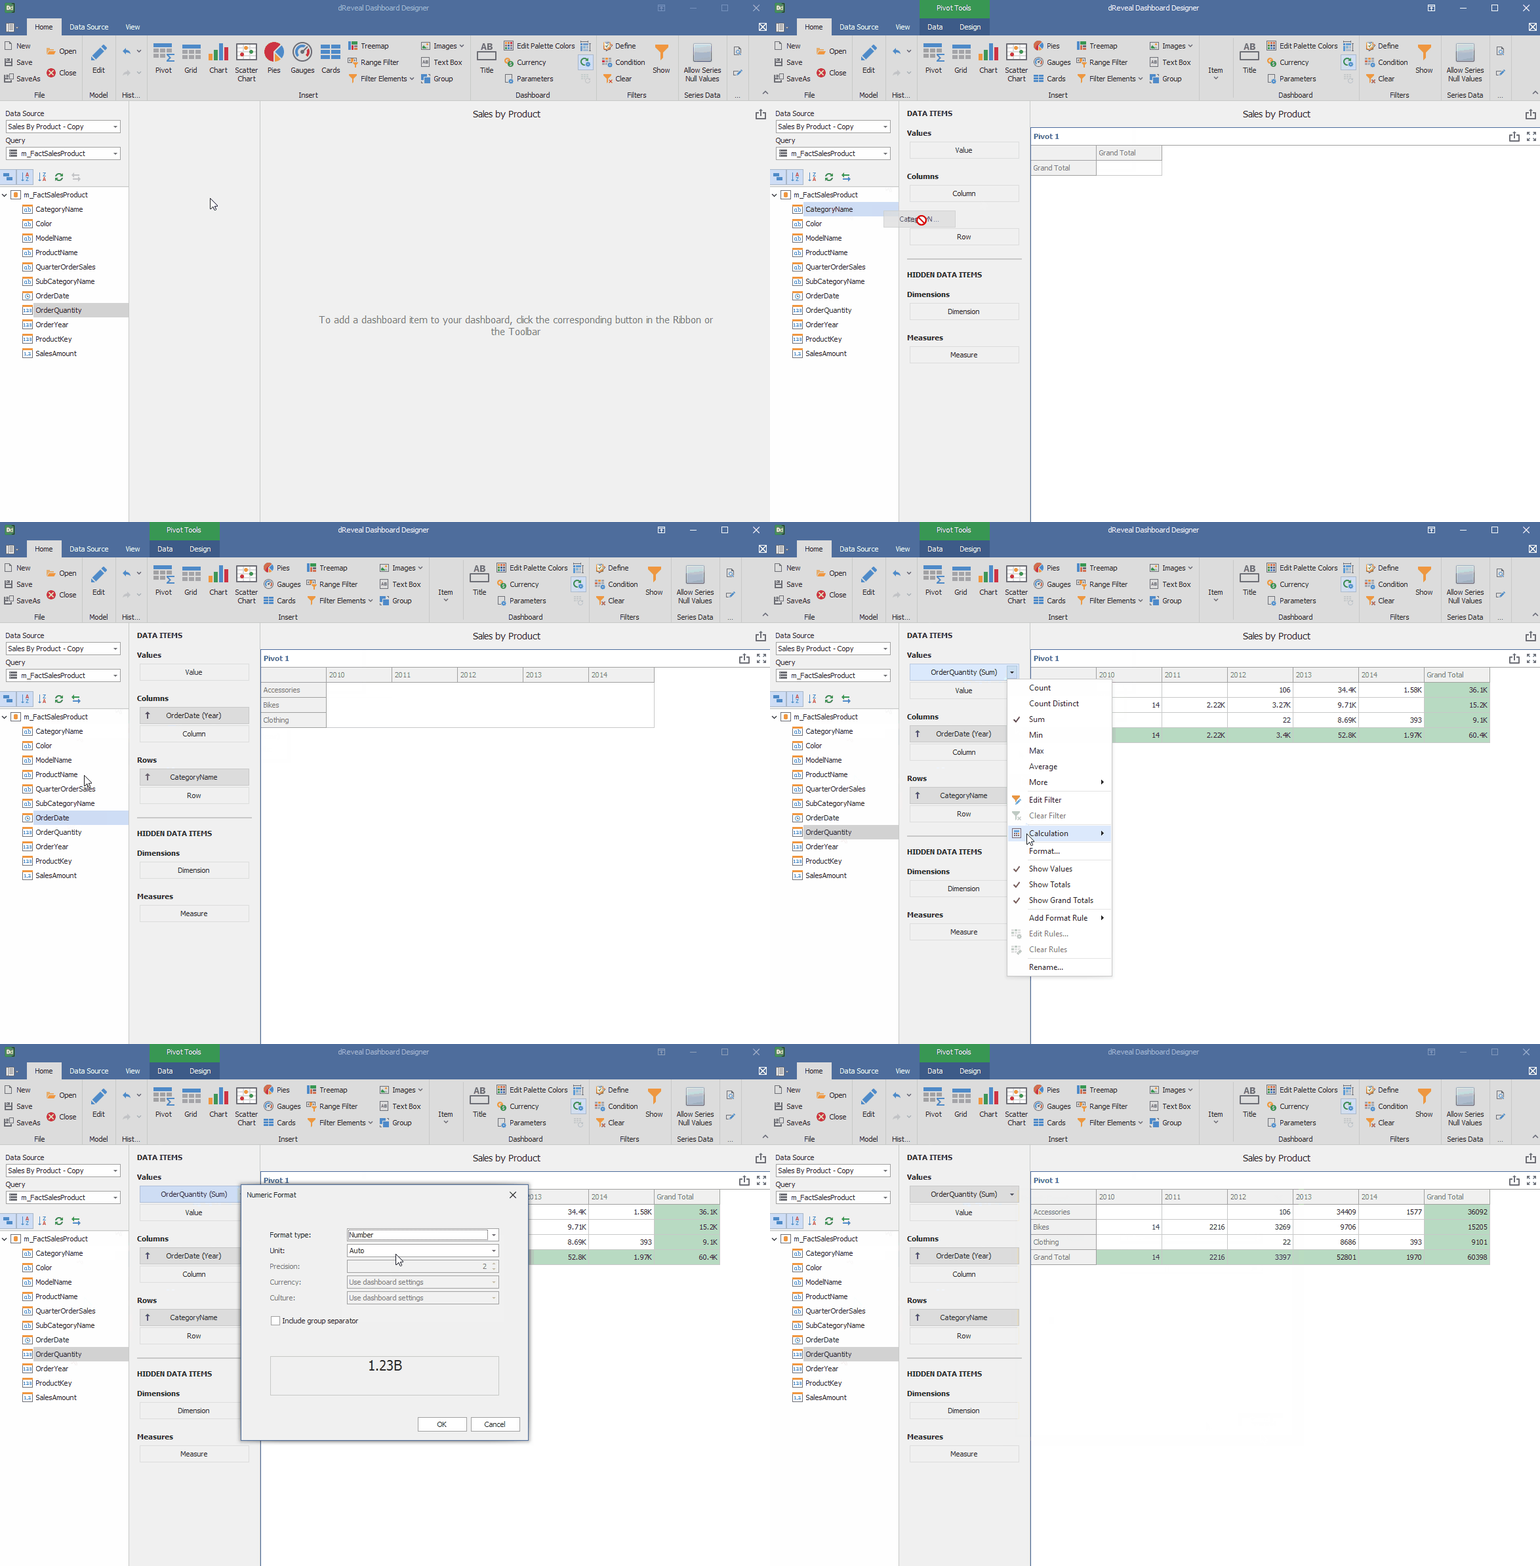
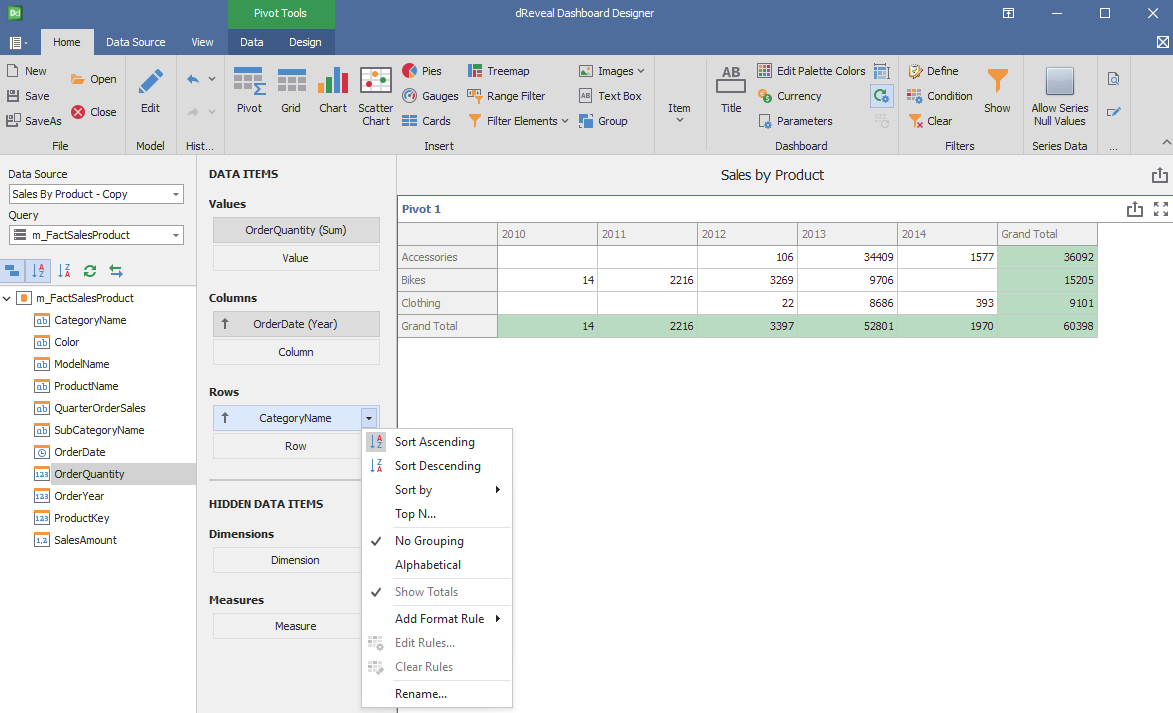
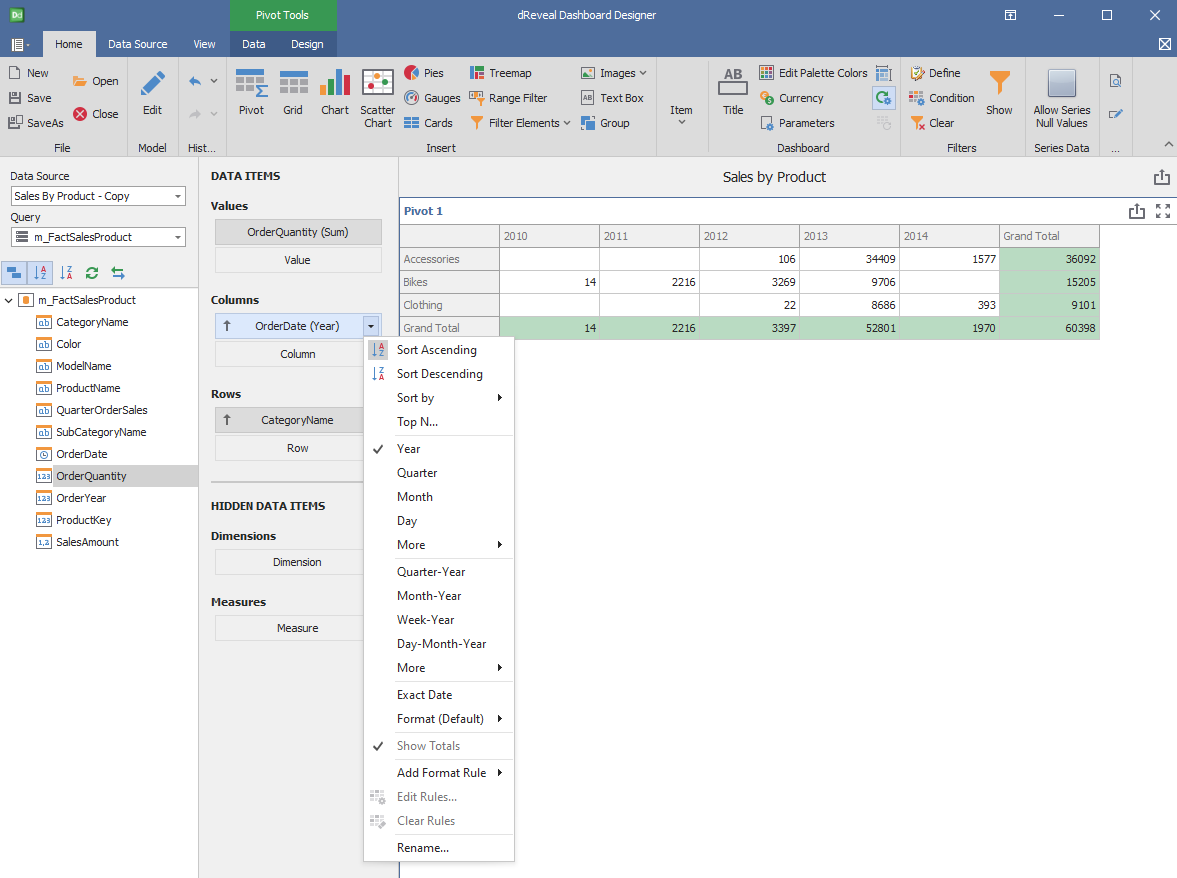
Dashboard Designer also provides various options to customize the 'Pivot Chart' based on the data type displayed in each column. Below is a general overview of the different options you can apply to your Pivot Chart.
Column of type String:
Column of type Date:
Column of type Numeric:
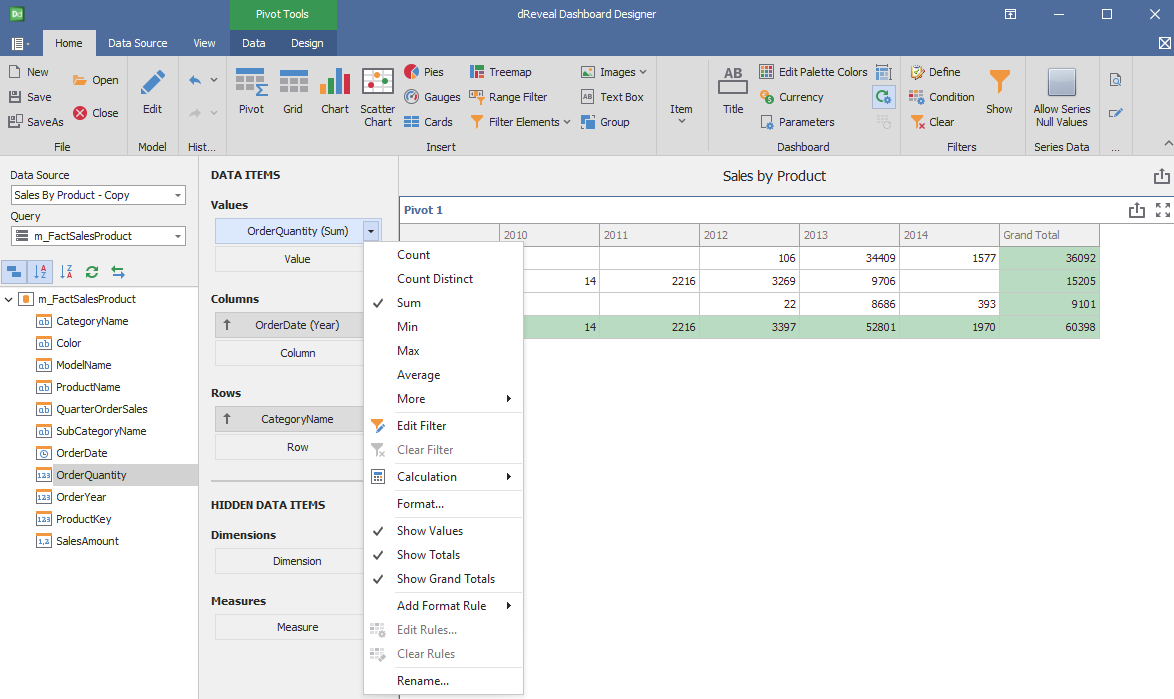
Design
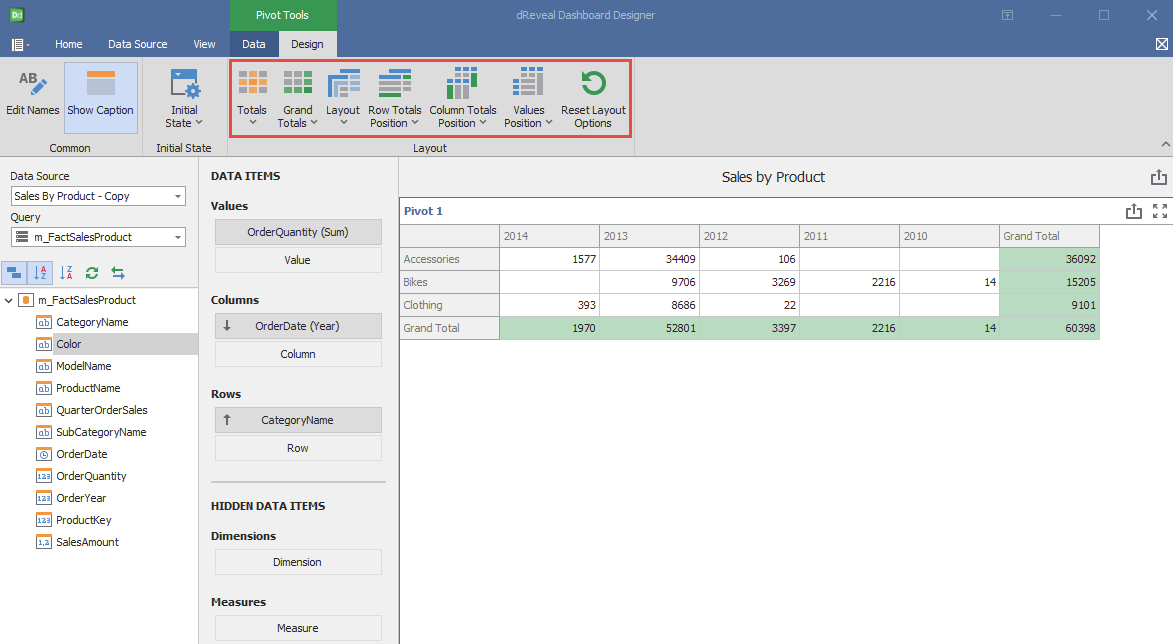
'Pivot Chart' has a variety of options in the 'Design' tab to customize your chart. Next, we will show you the different options you can apply to your Pivot chart.
Common
| Options | Description |
|---|---|
| Edit Names | Edit the name of the chart. |
| Show Caption | Show the dashboard item's caption. |
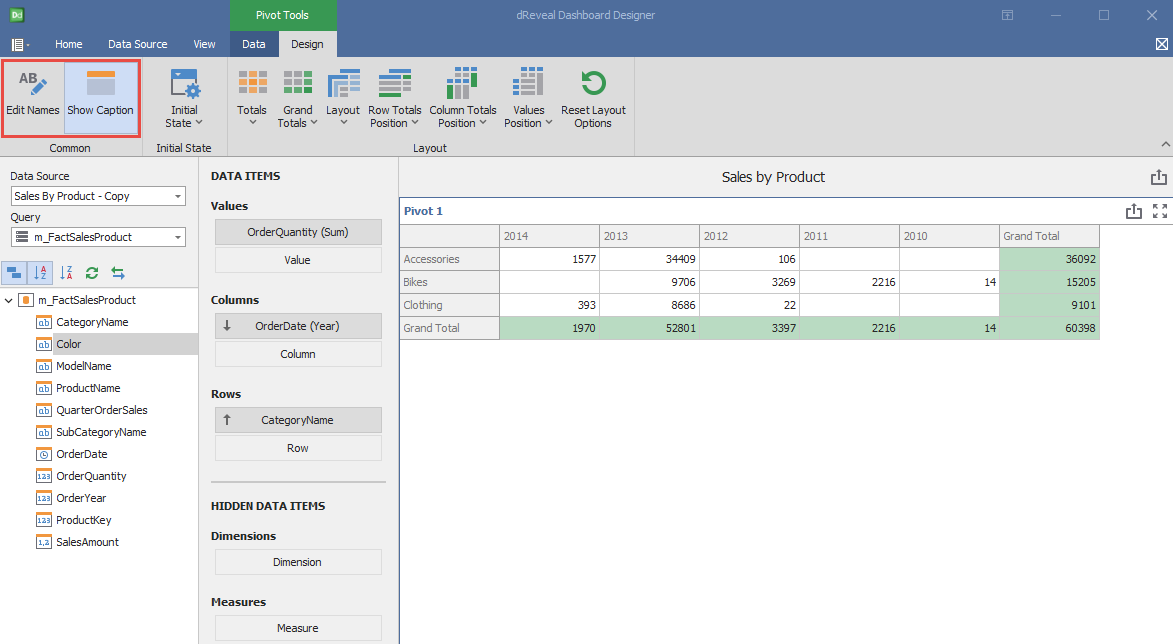
Initial State
| Options | Description |
|---|---|
| Initial State | Specify how the pivot dashboard item appears in the Dashboard Viewer by default. There are two options: Expand Column Groups and Expand Row Groups. |
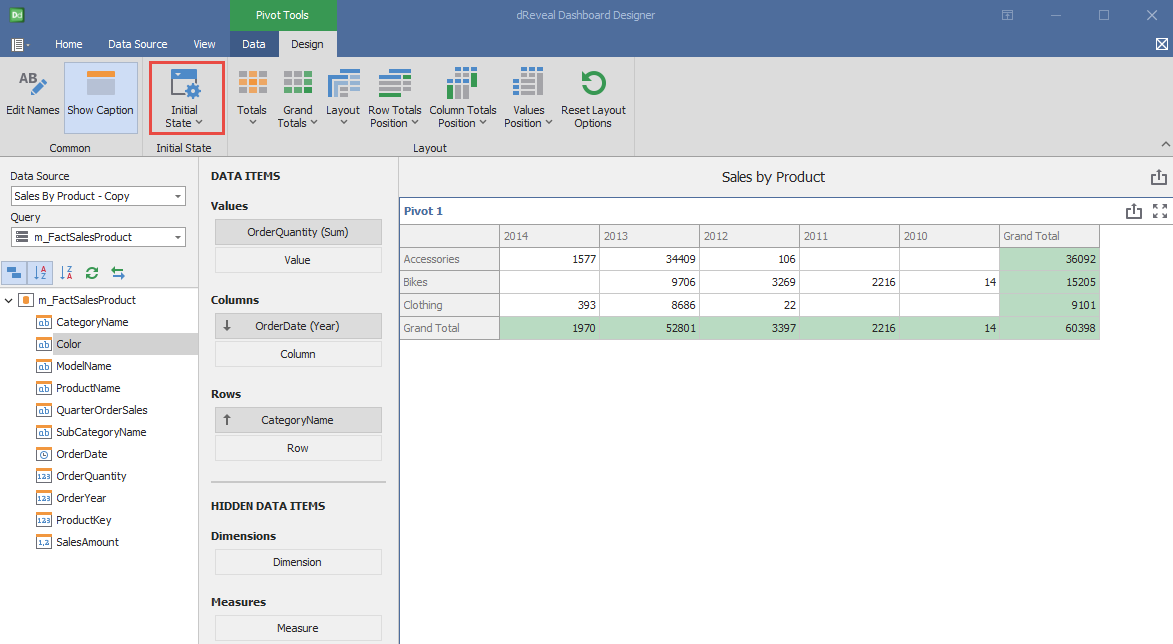
Layout
| Options | Description |
|---|---|
| Totals | Show Totals in the pivot dashboard item. There are two options: Show Column Totals and Show Row Totals. |
| Grand Totals | Show Grand Totals in the pivot dashboard item. There are two options: Show Column Grand Totals and Show Row Grand Totals. |
| Layout | Select a pivot table's layout. There are two options: Compact and Tabular. |
| Row Totals Position | Specify the row totals' position. There are two options: Top and Bottom. |
| Column Totals Position | Specify the column totals' position. There are two options: Near and Far. |
| Values Position | Specify the position of data headers used to arrange summary values. There are two options: Columns and Rows. |
| Reset Layout Options | Reset options related to a pivot table layout to their default values. |
