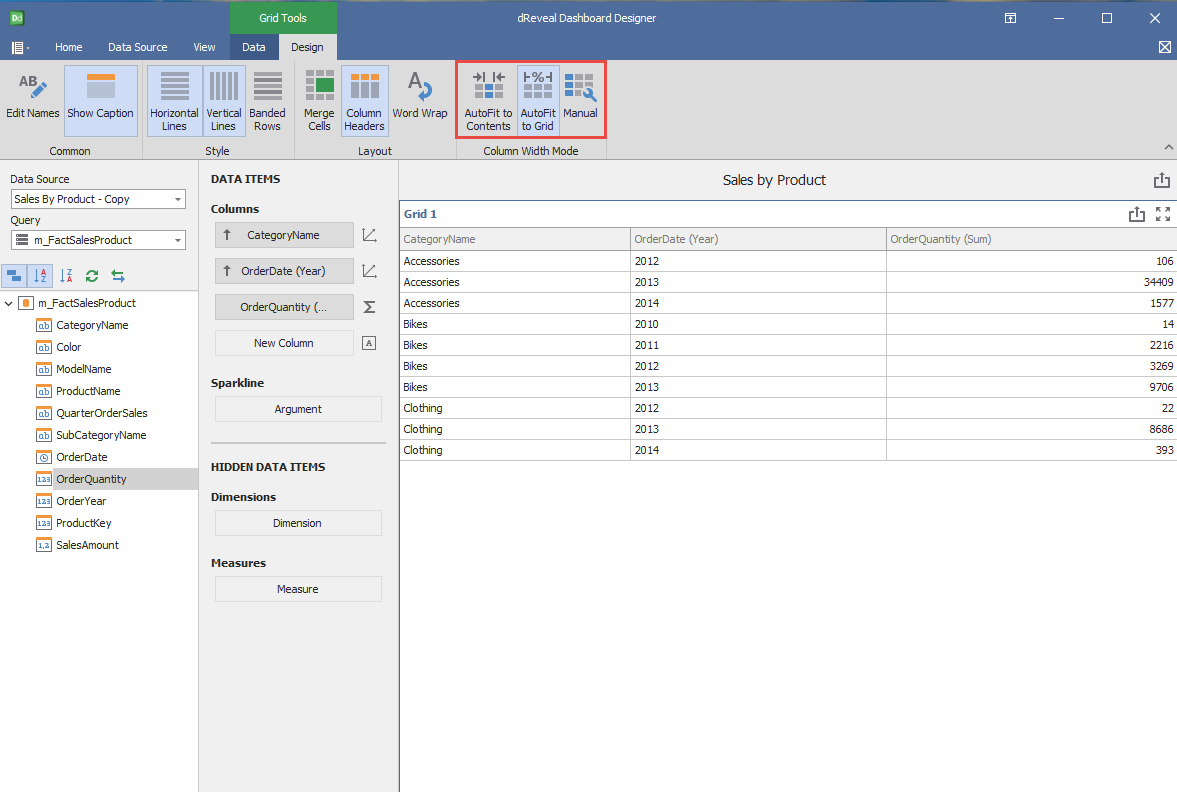
Grid Chart
The Dashboard Designer enables users to create highly customizable grid charts that provide a clear and concise visual representation of data. These charts are ideal for comparing multiple variables and highlighting trends. Additionally, users can configure and apply formatting to tailor the charts to their specific needs, facilitating data interpretation.
How to Create a Grid Chart:
To create a grid chart in the Dashboard Designer, follow these steps: first, open a new report or access an existing one. Then, click on the "Grid" icon. Next, drag and drop the columns you want to visualize from the main view to the "Columns" section under DATA ITEMS. Finally, customize the appearance of your chart by applying the desired formatting, especially to numeric columns.
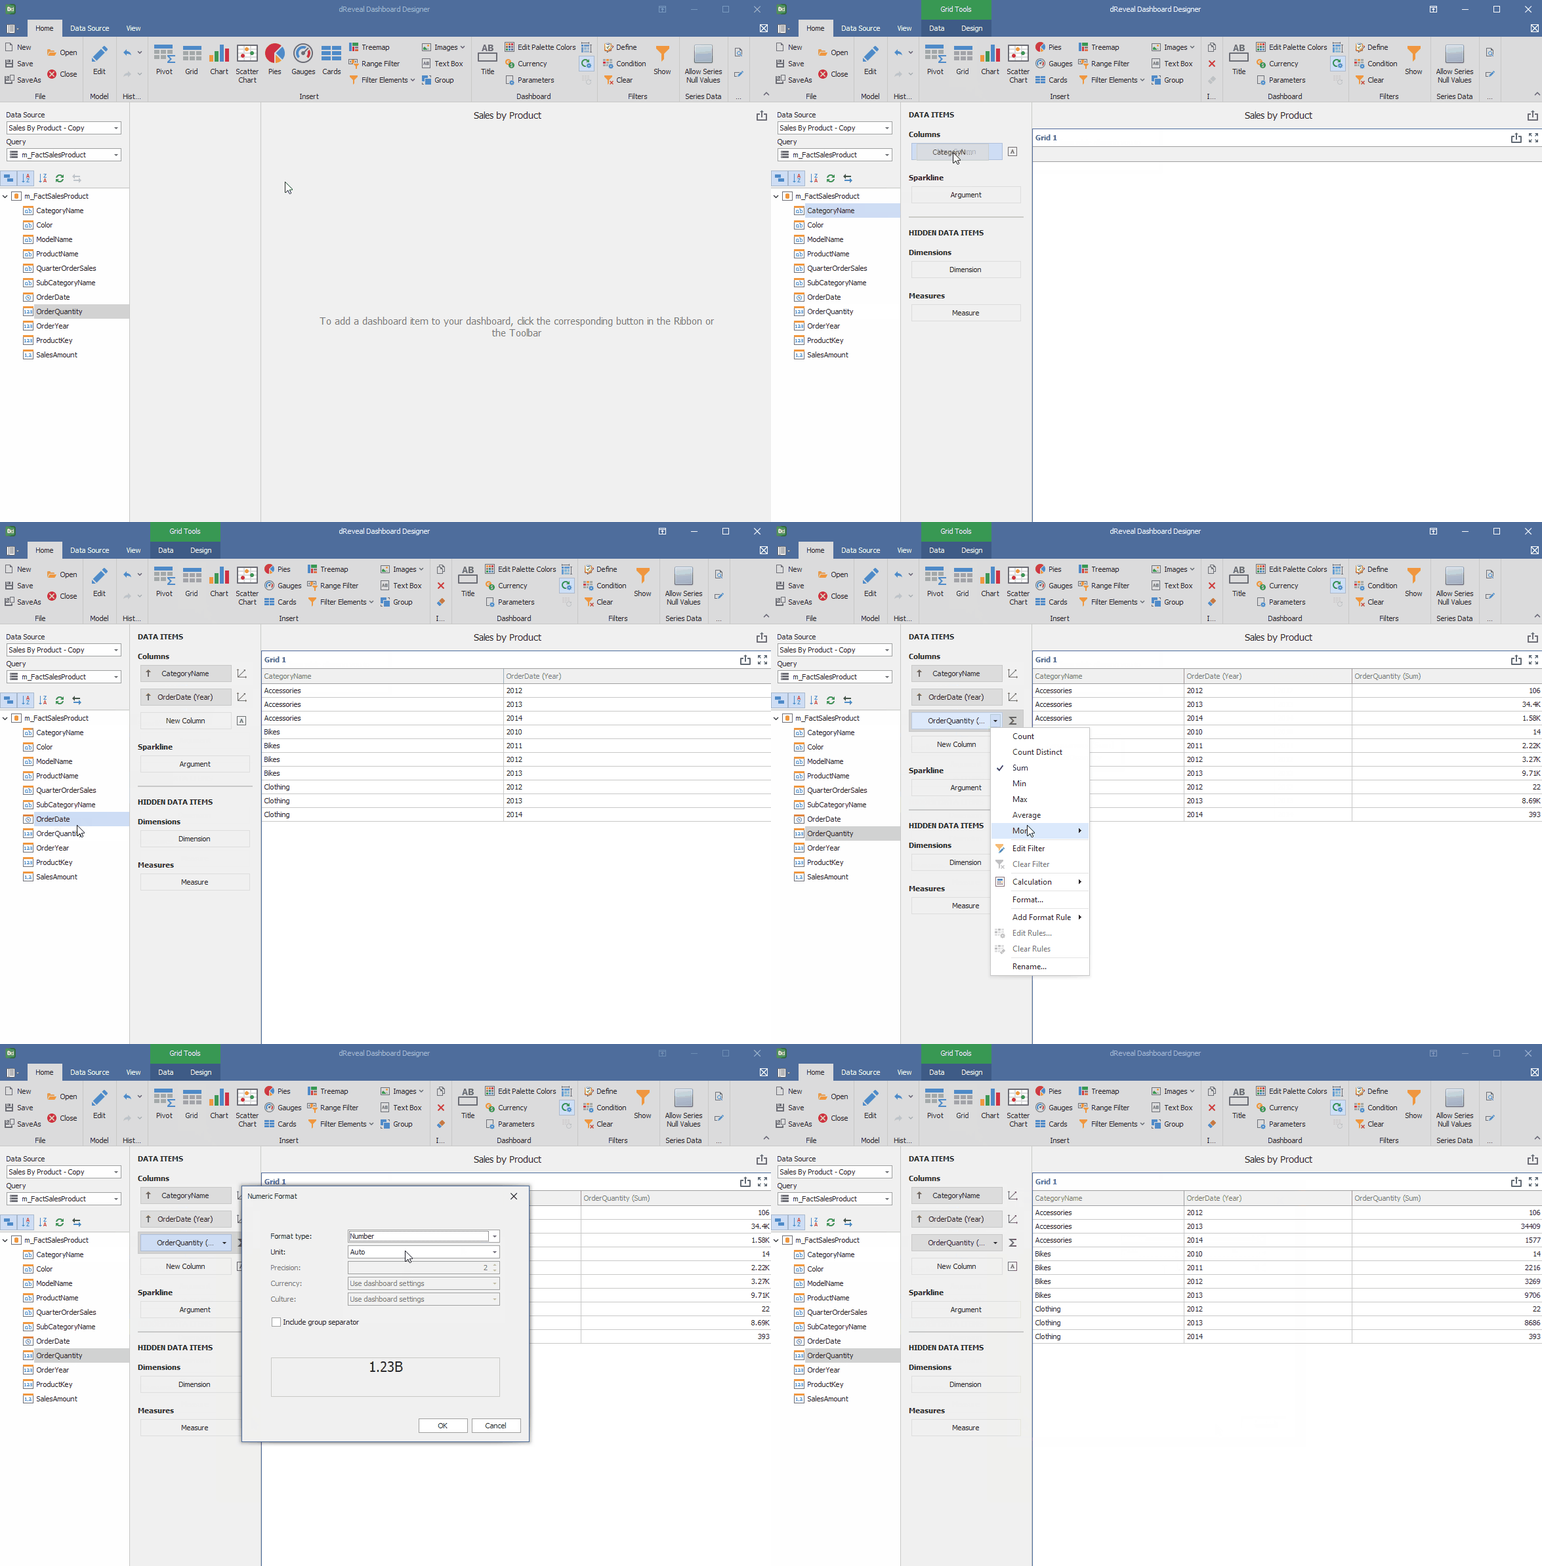
Dashboard Designer also provides various options to customize the 'Grid Chart' based on the data type displayed in each column. Below is a general overview of the different options you can apply to your Grid Chart.
Column of type String:
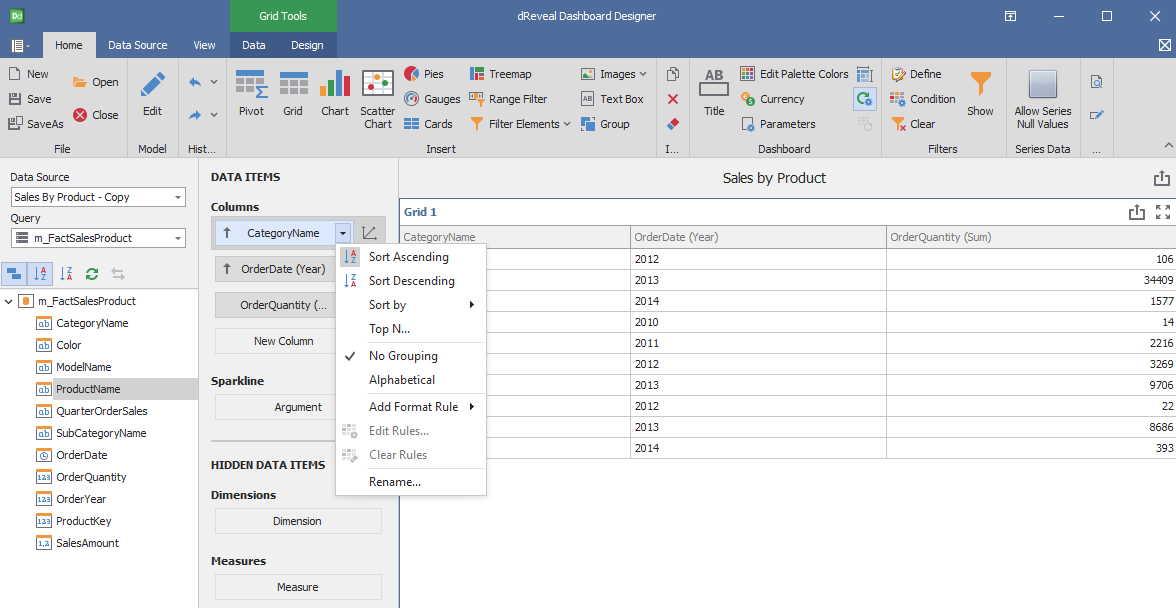
Column of type Date:
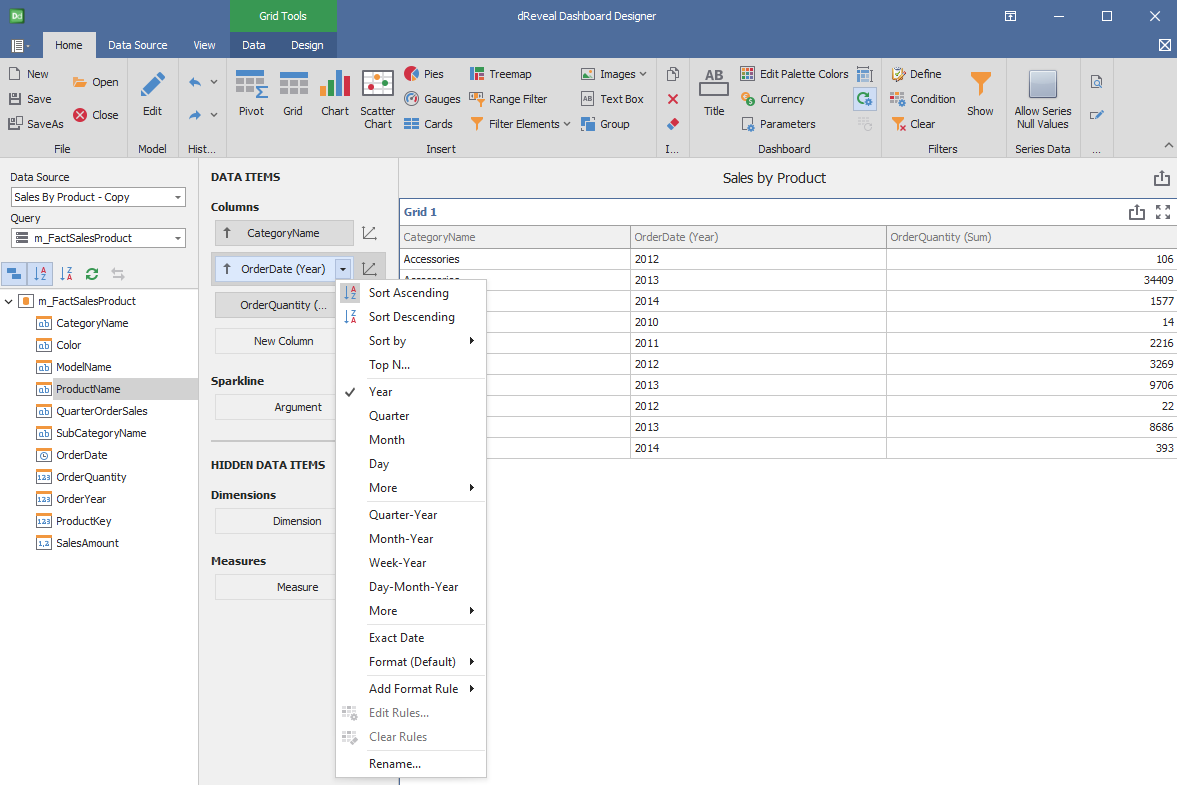
Column of type Numeric:
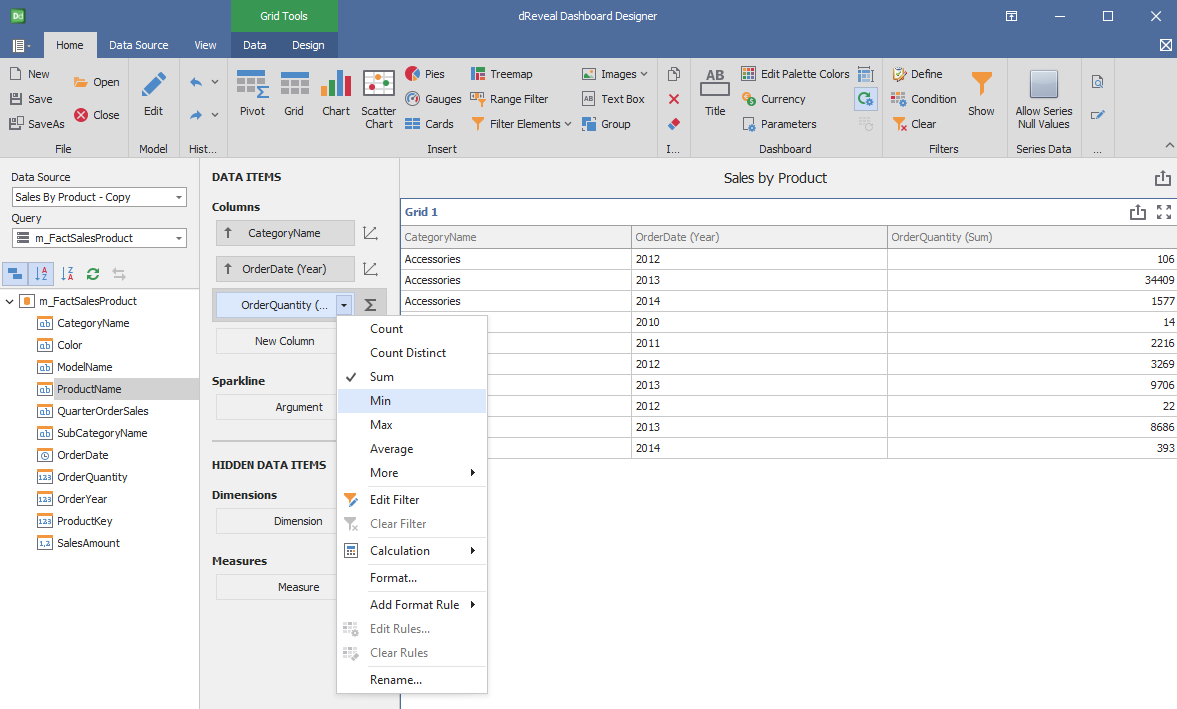
Design
'Grid Chart' has a variety of options in the 'Design' tab to customize your chart. Next, we will show you the different options you can apply to your Grid chart.
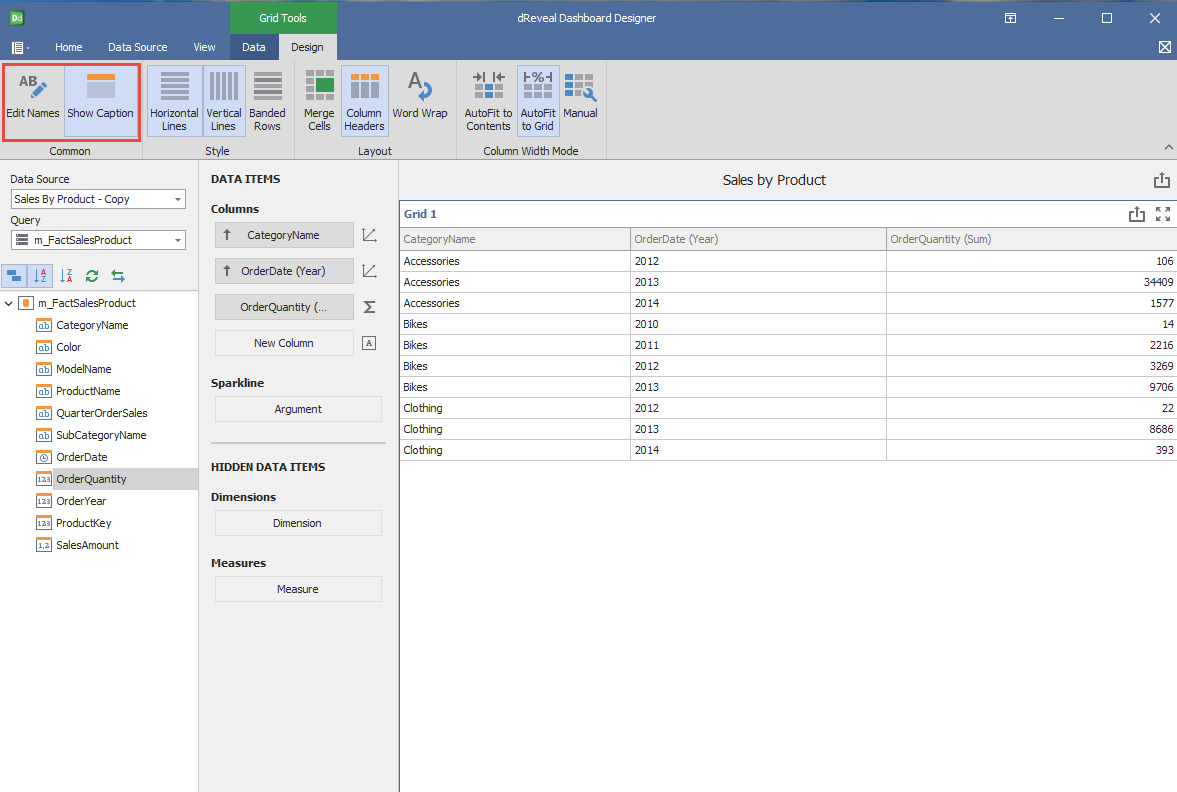
Common
| Options | Description |
|---|---|
| Edit Names | Edit the name of the chart. |
| Show Caption | Show the dashboard item's caption. |
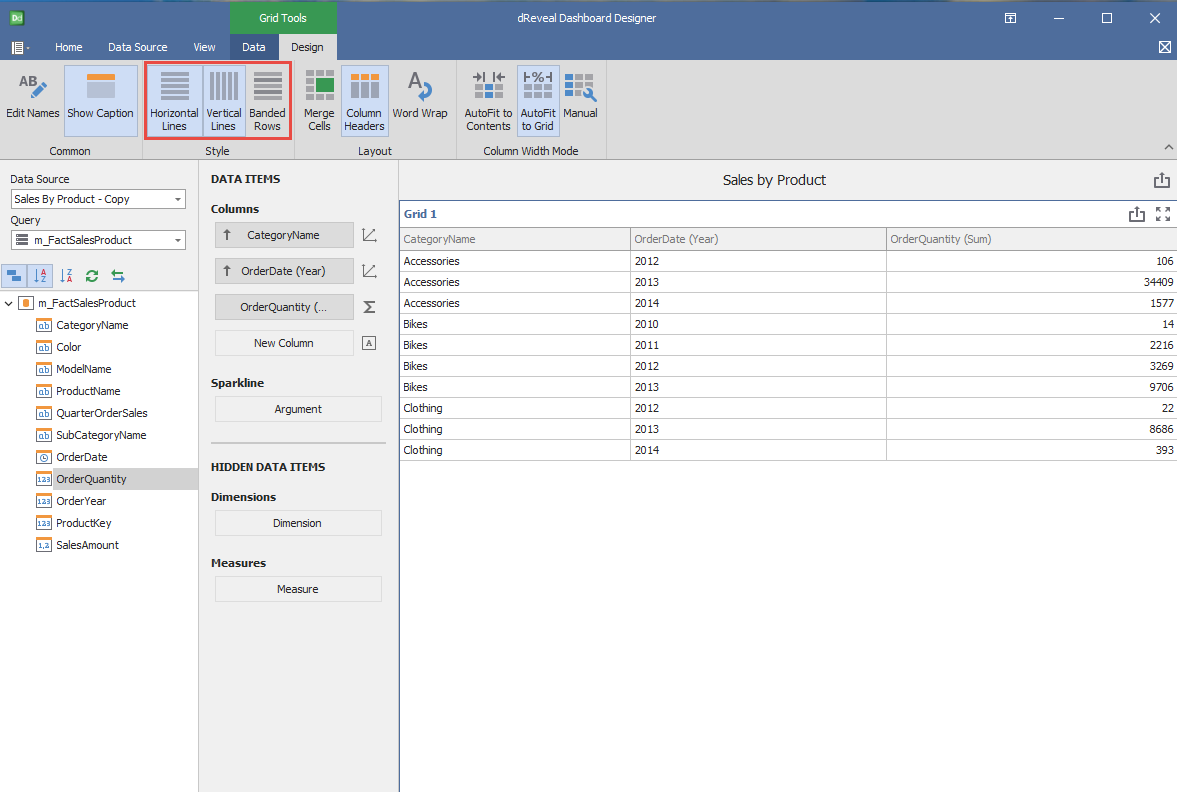
Style
| Options | Description |
|---|---|
| Horizontal Lines | Show horizontal grid lines. |
| Vertical Lines | Show vertical grid lines. |
| Banded Rows | Paint the background of even and odd rows differently to make the grid easier to read. |
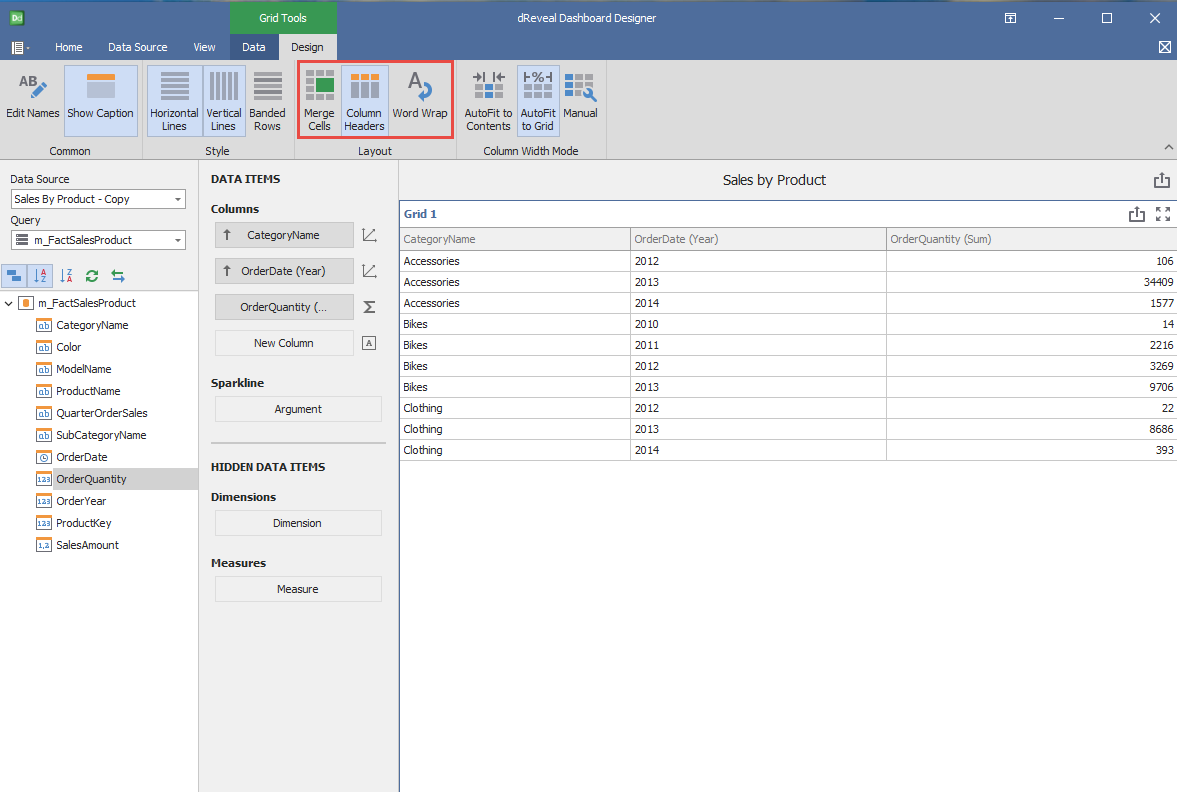
Layout
| Options | Description |
|---|---|
| Merge Cells | Merge adjacent cells with identical data. |
| Column Headers | Show column headers. |
| Word Wrap | Enable word wrapping that allows displaying cell content on multiple lines. |
Column Width Mode
| Options | Description |
|---|---|
| AutoFit to Contents | Adjust the width of columns automatically to display their content entirely. If the grid cannot display the entire content, horizontal scrolling is enabled. |
| AutoFit to Grid | Adjust the width of columns automatically to display their content in an optimal way depending on grid width. |
| Manual | Adjust the width of columns manually. |
