Cards
Dashboard Designer empowers users to create detailed, customized reports, generating dynamic visualizations that offer a deep and adaptable view of their data. With a wide range of visualization options, this tool enables users to intuitively analyze and visualize trends, tailored to their specific needs.
How to Create a Cards:
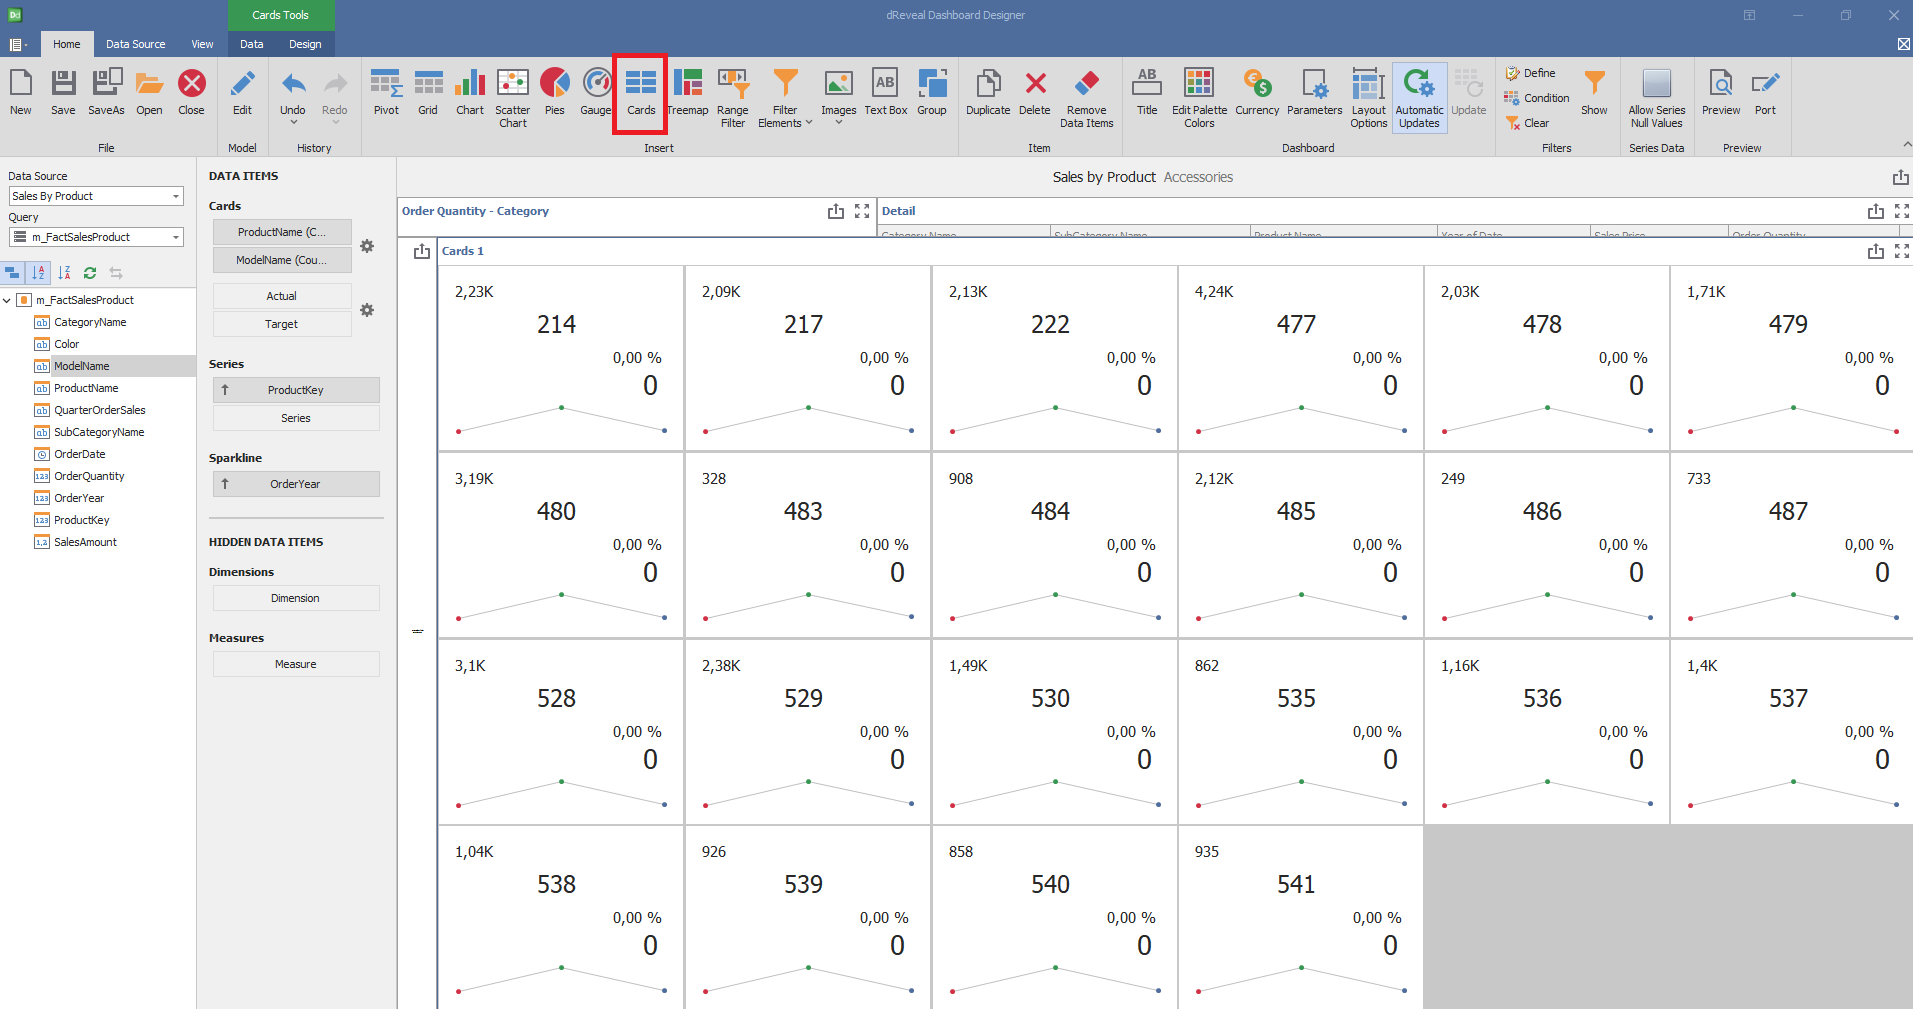
In the Dashboard Designer, begin by opening your desired report. To incorporate a card, click on the 'Cards' icon. Subsequently, drag and drop the relevant columns from the main view into the 'Data Items' > 'Columns' section to specify the card's data.

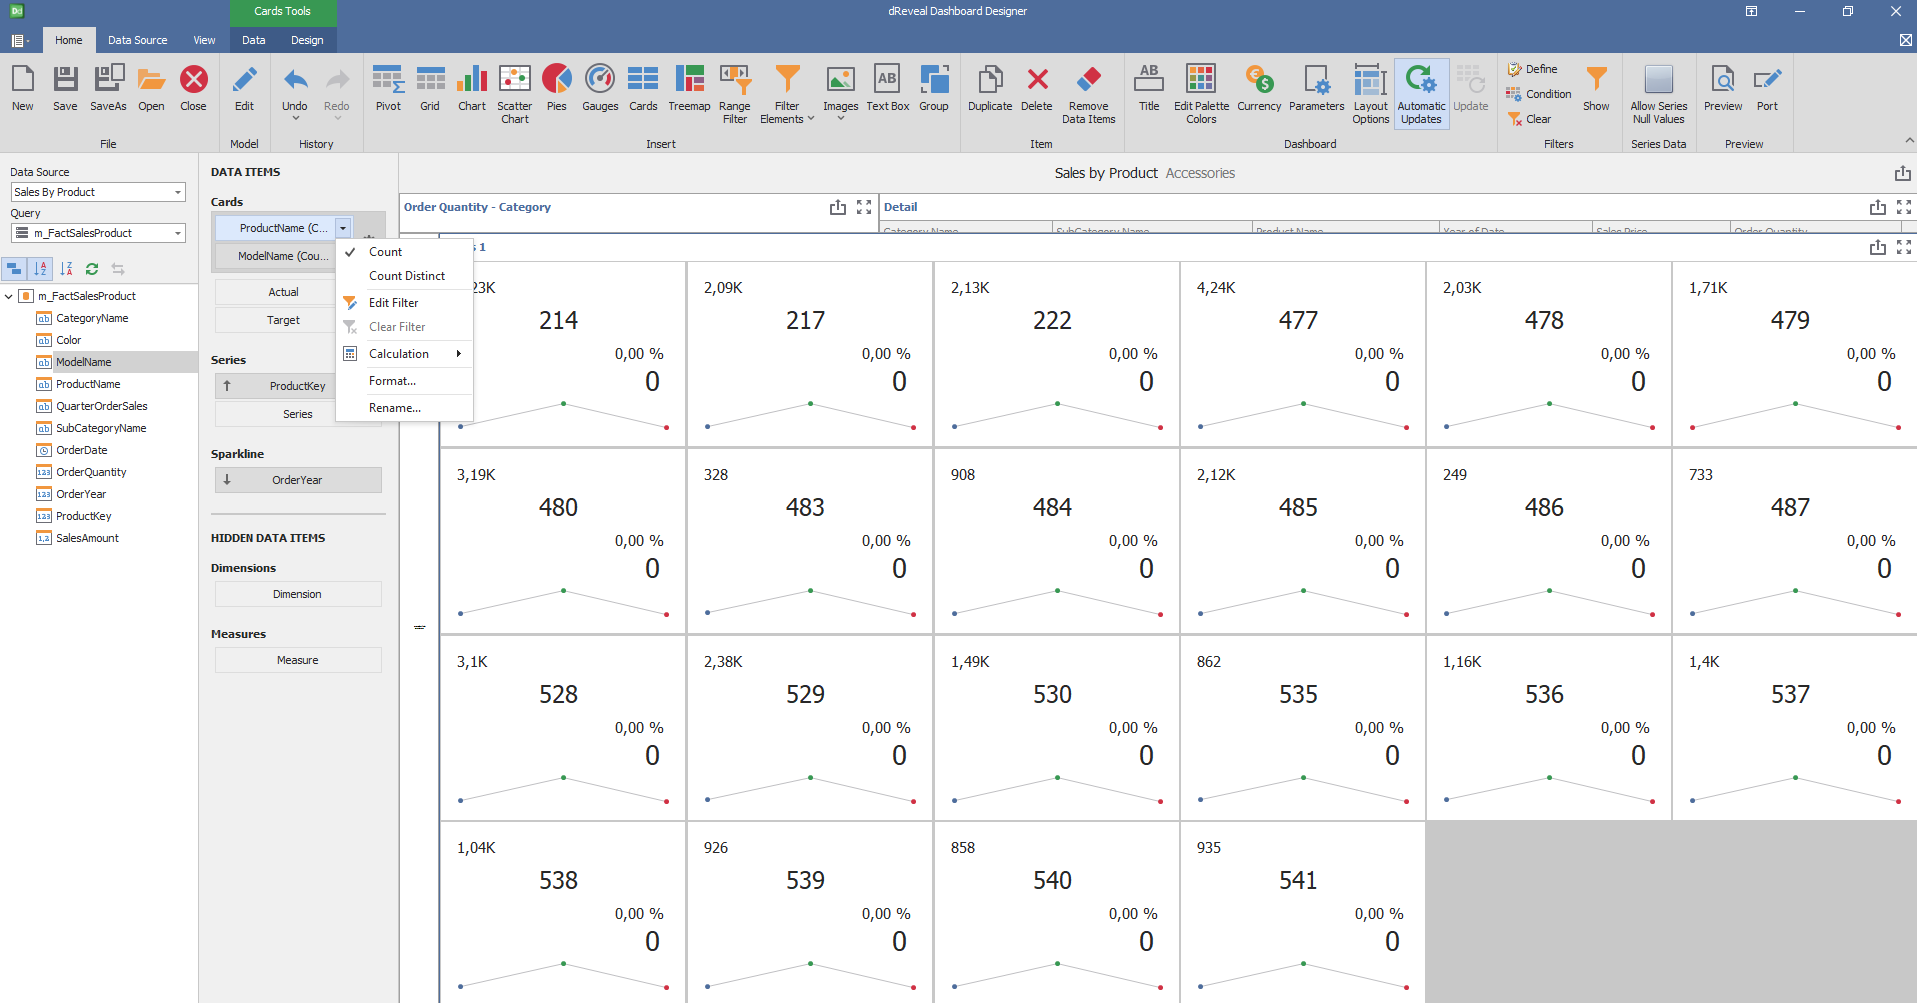
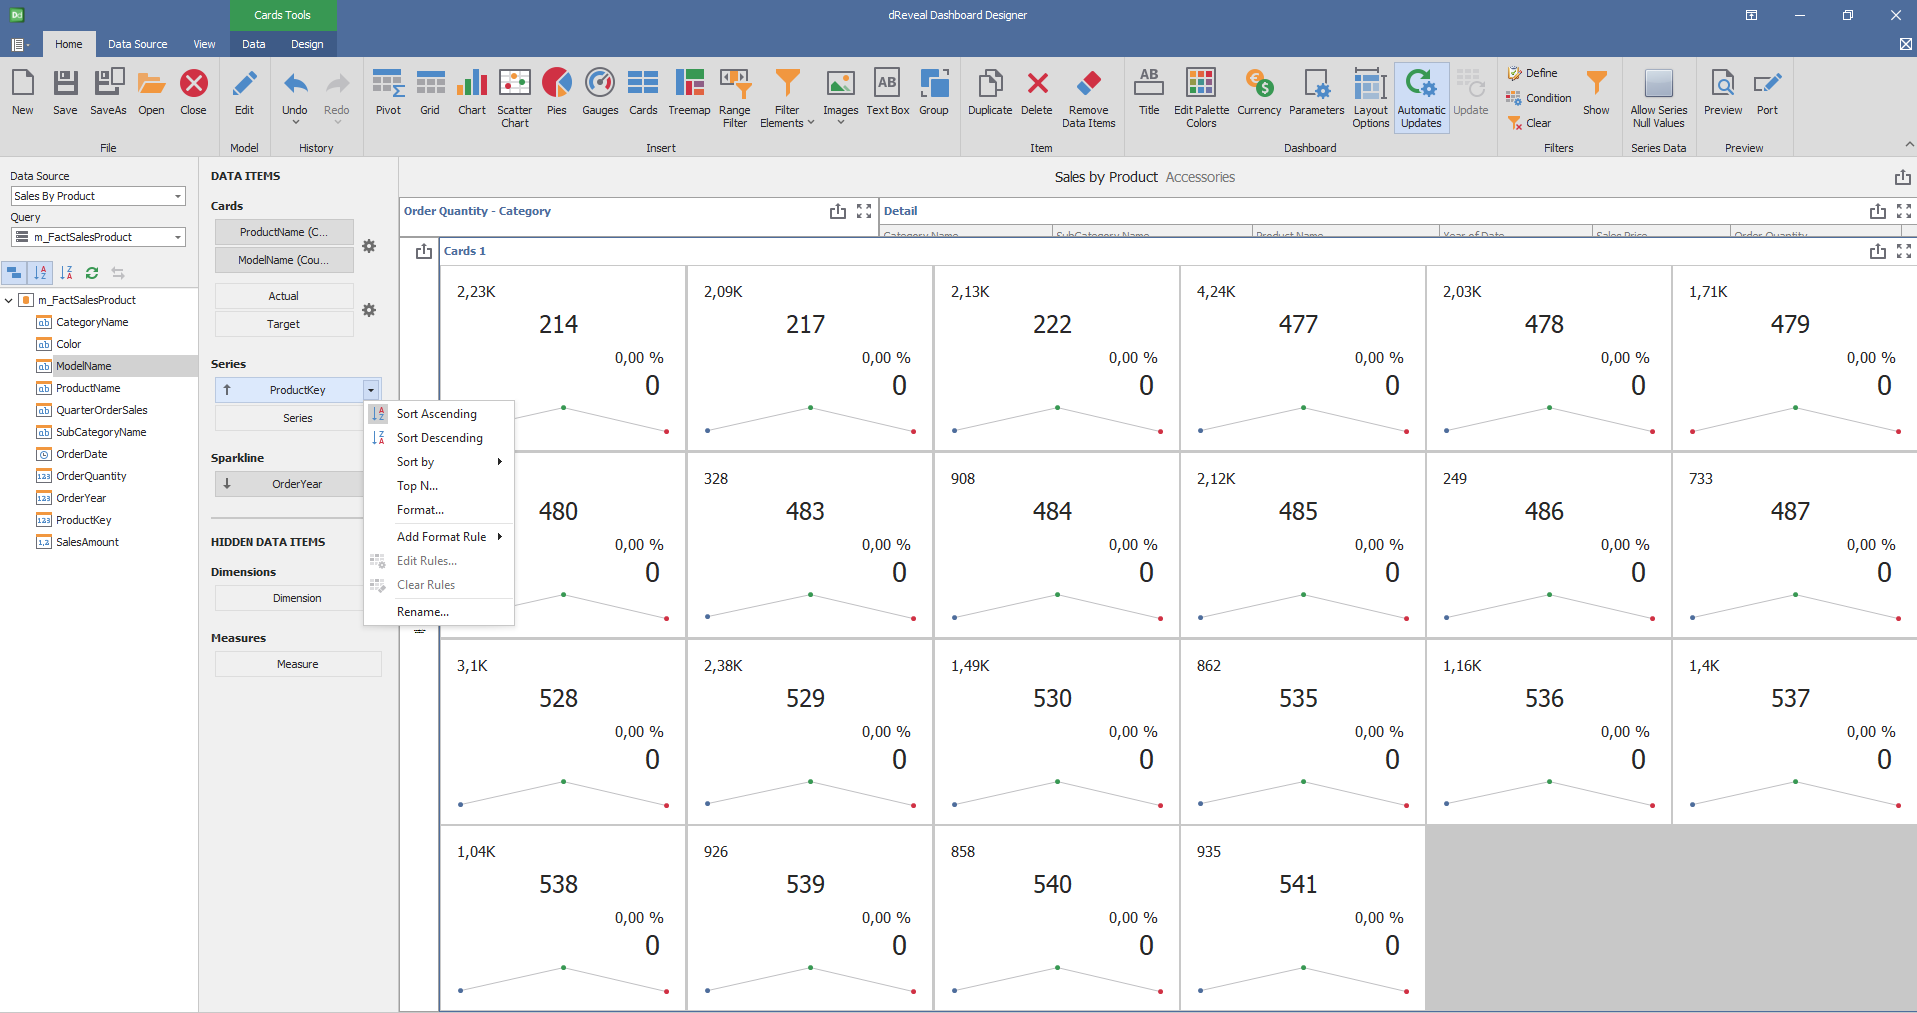
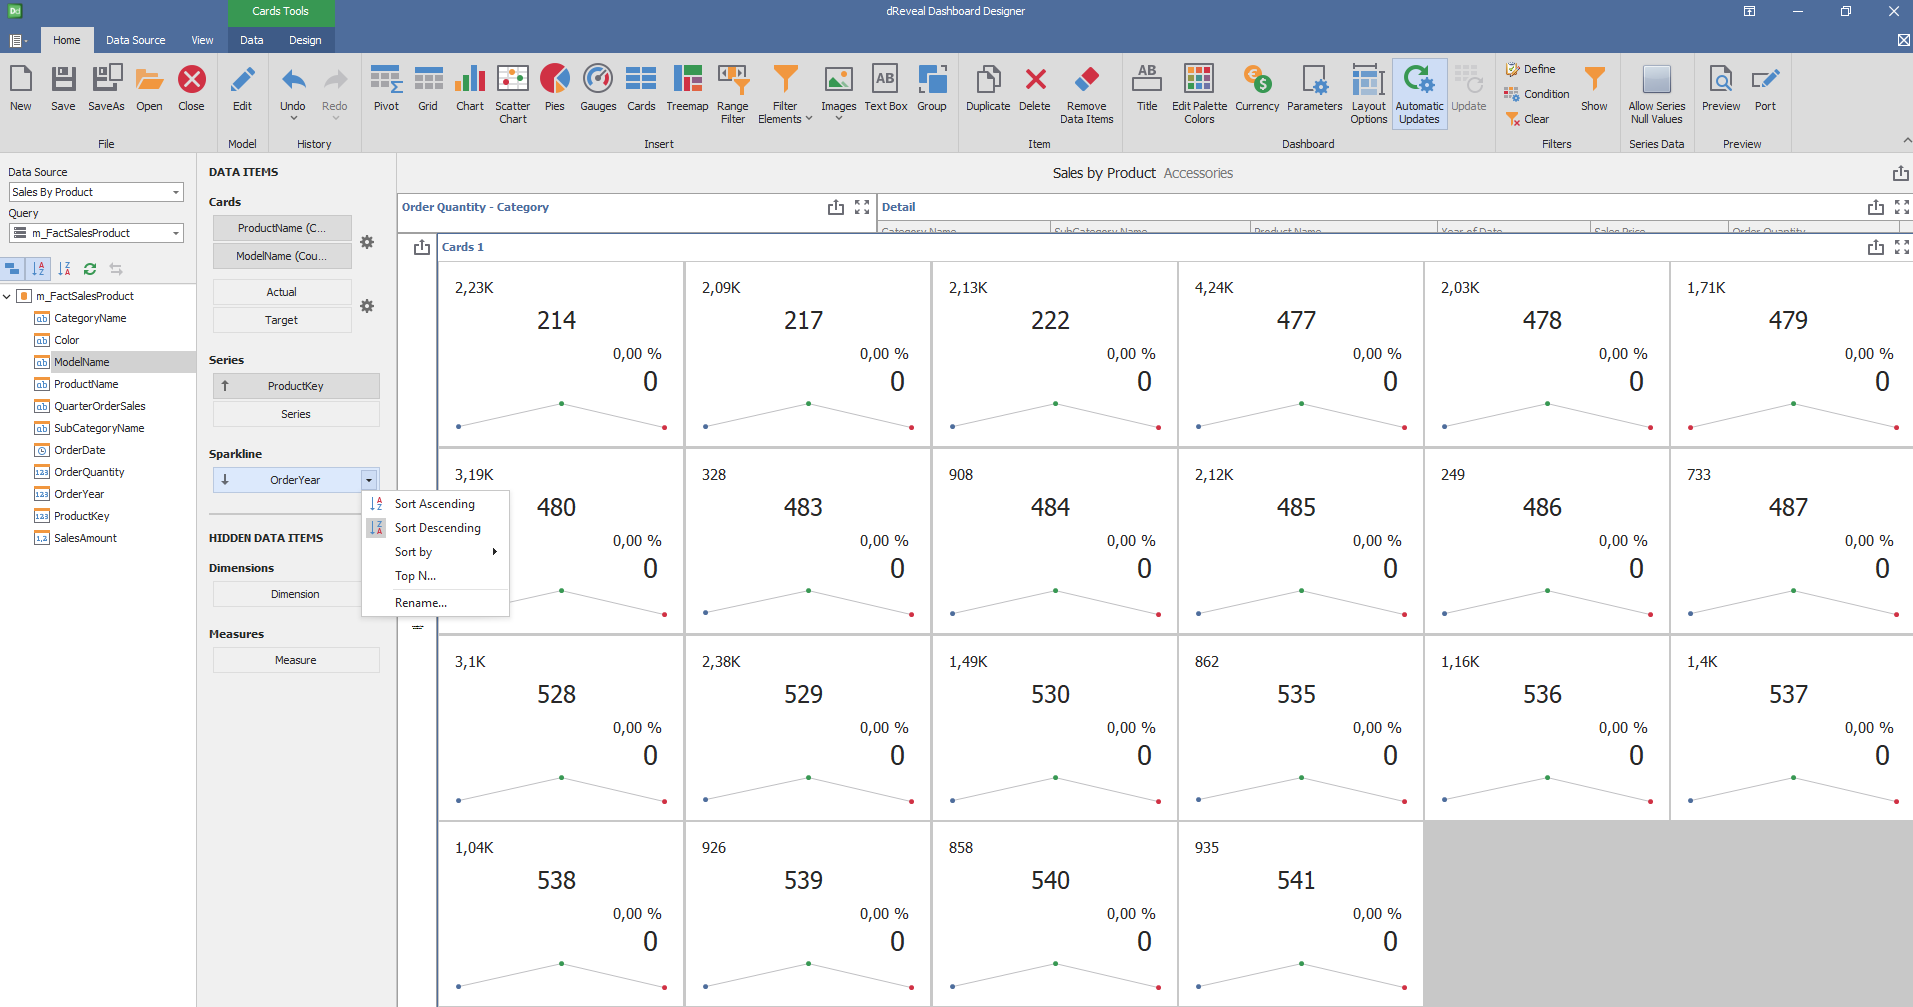
Dashboard Designer also provides various options to customize the 'Cards' based on the data type displayed in each column. Below is a general overview of the different options you can apply to your Cards Chart.
Column of type String

Column of type Numeric:

Column of type Date:

Design
Dashboard Design also provides various options to customize the 'Cards Graph' based on the data type displayed in each column. Below is a general overview of the different options you can apply to your Graph.
Content Arrangement
| Options | Description |
|---|---|
| Auto Arrange | The number of columns and rows is defined automatically. |
| Arrange in Columns | Arrange the elements in the specified number of columns. |
| Arrange in Rows | Arrange the elements in the specified number of rows. |
