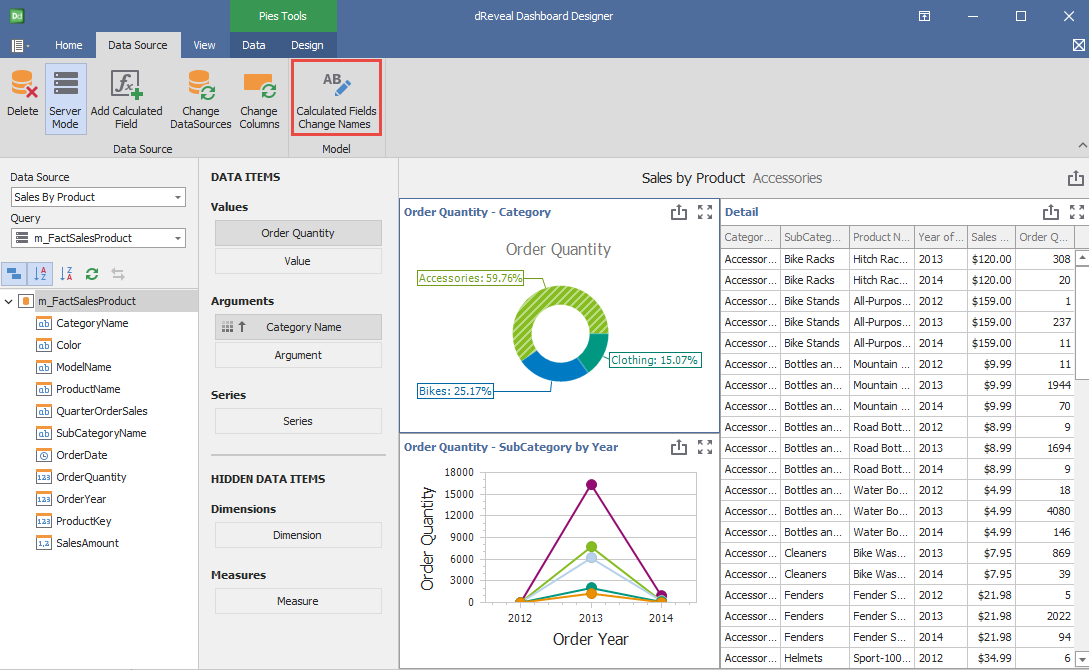
Data Source
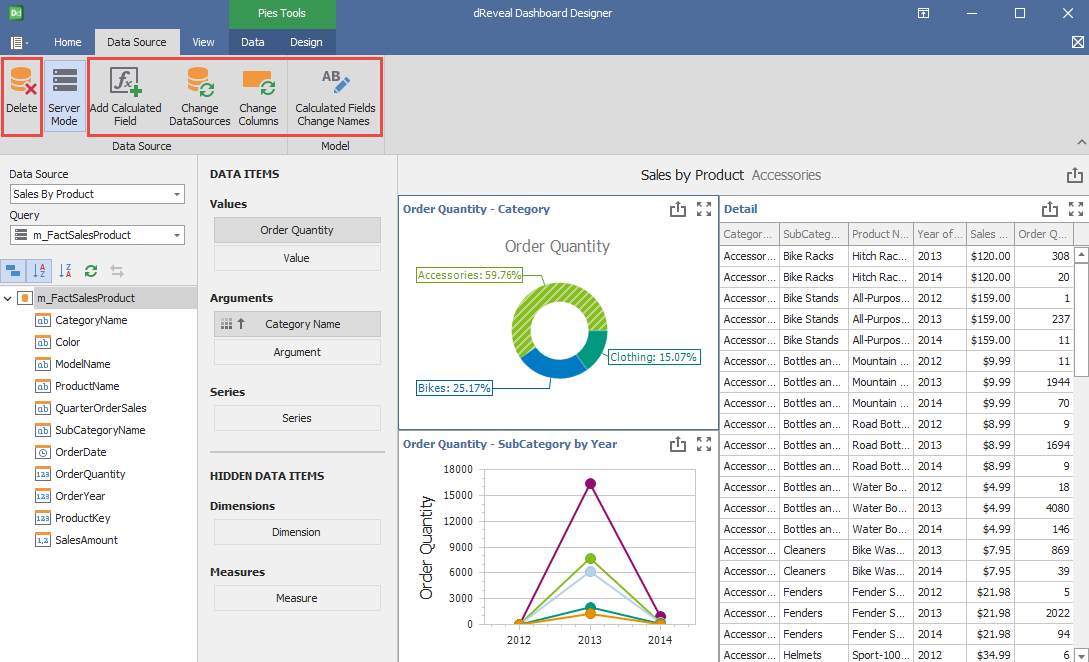
Dashboard Designer provides users with the ability to perform a variety of key actions, such as seamlessly adding calculated fields, renaming them as needed, switching data sources on the fly, and easily adjusting column selections within the data source. With these capabilities, users can tailor their reports precisely to their requirements, ensuring clarity and relevance in every. These options will be detailed later on.
Dashboard Designer also provides the ability to apply certain actions to the selected view in the report, as we will detail below:
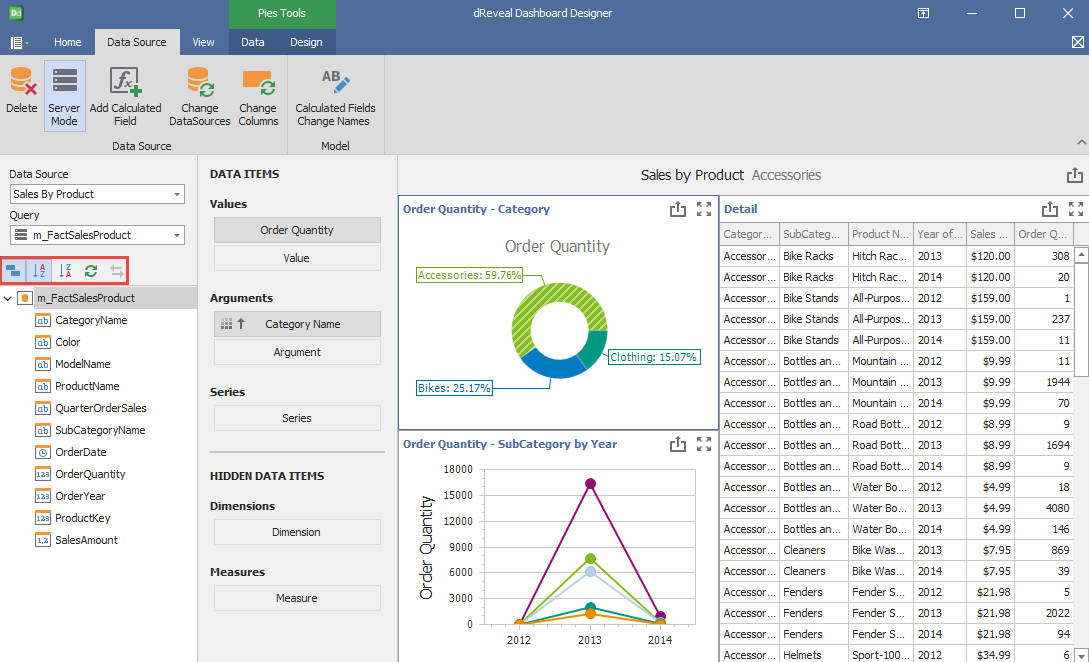
- Group Fields by Type: This option groups the fields according to the data type of each one.
- Sort Fields A to Z: This option applies ascending sorting to the fields.
- Sort Fields Z to A: This option applies descending sorting to the fields.
- Reload data: This option reloads the data if a column is included or unlinked from the selected view.
- Change the data source: This option changes the data source of a selected chart if working with another view in the same report.
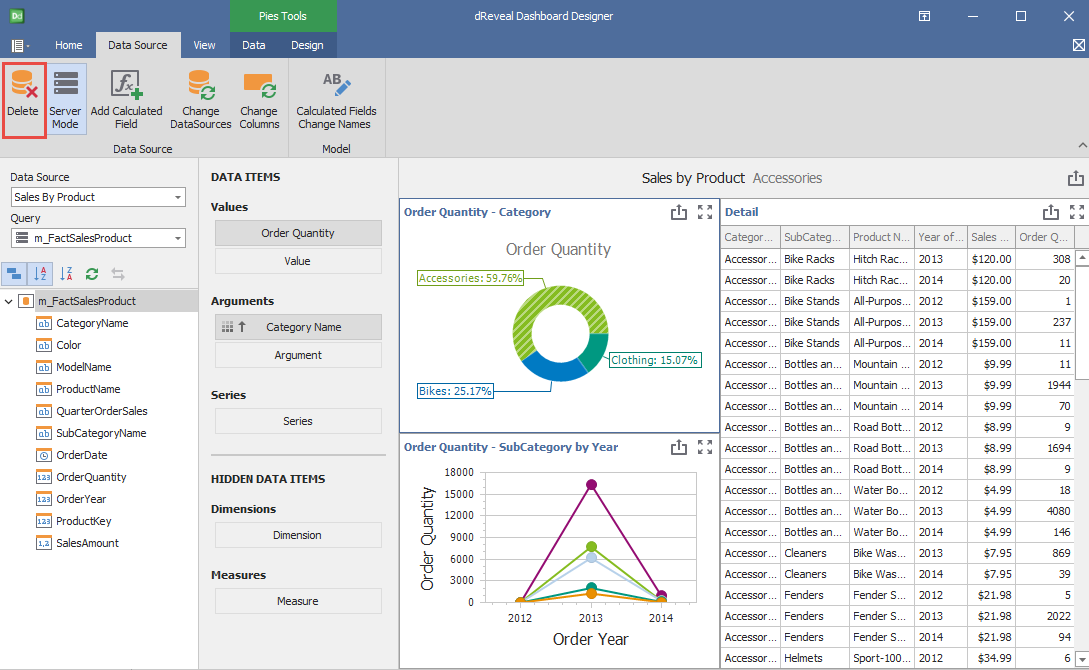
Delete
This option removes the current data source, meaning the connection the system establishes with the database from which it obtains data. By removing this source, the flow of information between the system and the data origin is disconnected, which may result in the loss of access to the original information and the inability to automatically update the data.
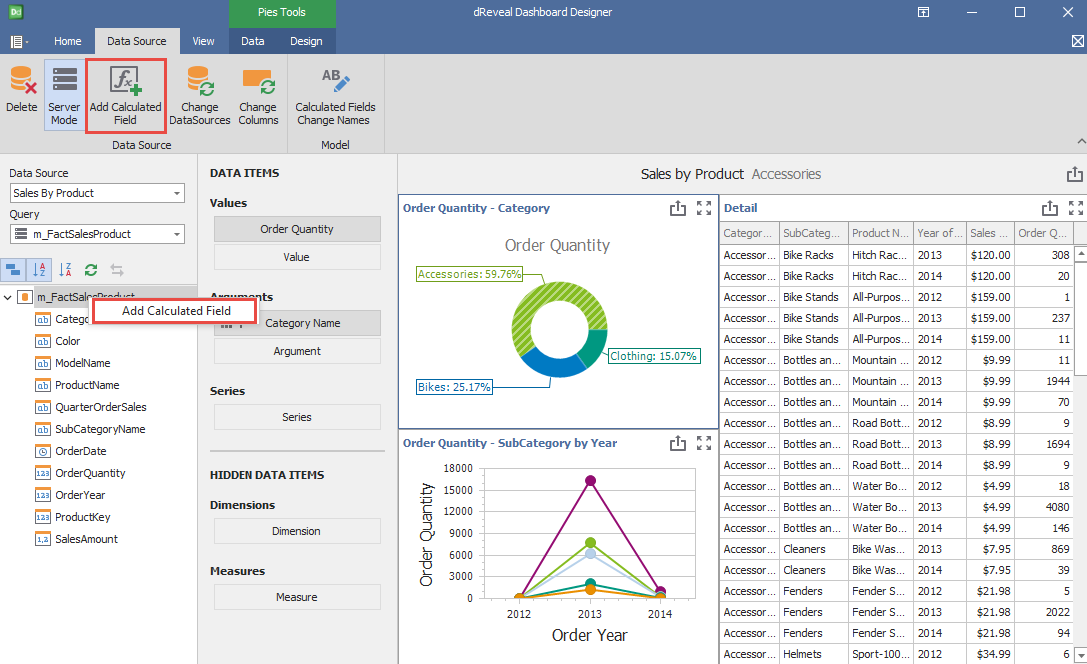
Add Calculated Field
This option allows the user to create custom calculated fields, enabling users to tailor their reports to specific needs. Calculated fields are expressions that utilize other existing fields in the report. Instead of containing physically stored data, a calculated field generates its value based on data in other fields. This allows for additional calculations, manipulations, and analysis on existing data, which can be useful for obtaining specific information or performing customized operations according to user needs.
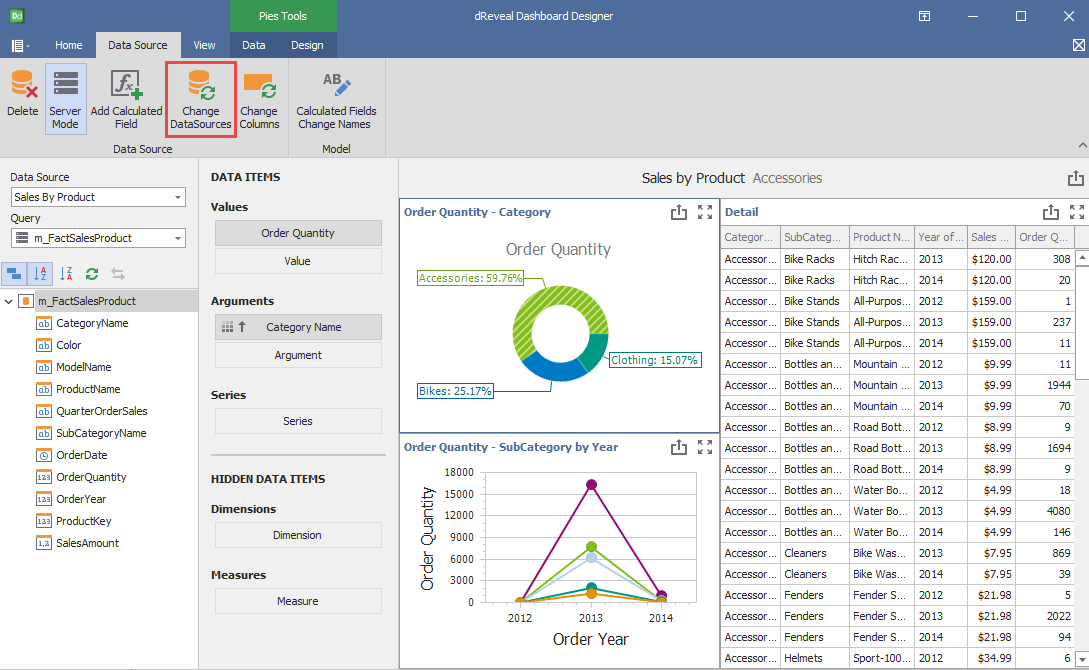
Change DataSources
This option provides users with the flexibility to change the data source, which is ideal when an additional perspective is needed for the report. By adding a new view, users can select the specific column from the new data source they want to include in the analysis. This feature enables the creation of more comprehensive reports tailored to the user's specific needs
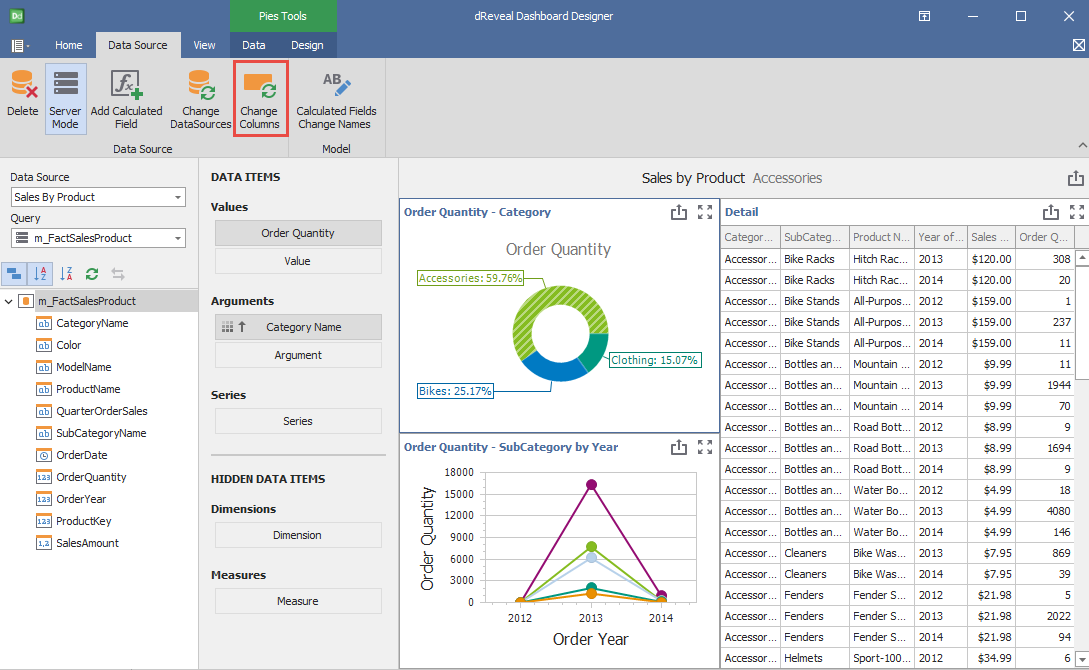
Change Columns
This option allows users to customize the report to their specific needs by selecting or deselecting the columns they want to view. By changing the view, users can choose which specific data fields are relevant to their analysis, providing greater flexibility in exploring the information.
Calculate Fields Change Names
This option allows users to further customize the report by changing the names of calculated fields. This is useful when the original names are not descriptive enough or when you want to use terminology that is more aligned with the context of the analysis.
