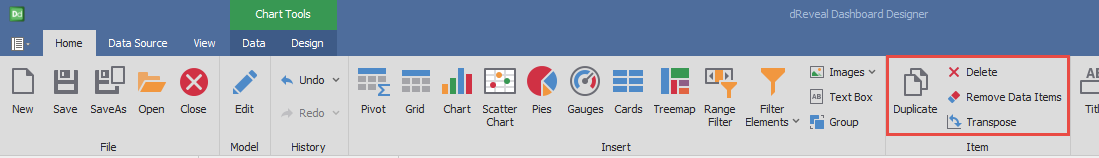
Item
Dashboard Designer allows the user to perform actions such as Duplicate, Delete, Remove Data Items, and Transpose. With these actions, users can precisely tailor their reports to their needs.
Duplicate
The action of duplicating a chart allows users to create reports more quickly and efficiently, reducing the time spent on manually designing similar graphics.
Steps to Duplicate a chart:
- Open Dashboard Designer.
- Create a new report or open an existing one.
- Select the chart.
- Click on the "Duplicate" icon.
Delete
The action of deleting a chart allows users to create reports more efficiently by removing unnecessary elements and focusing on the most important data.
Steps to Delete a chart:
- Open Dashboard Designer.
- Create a new report or open an existing one.
- Select the chart.
- Click on the "Delete" icon.
Remove Data Items
This action allows the user the ability to remove specific data elements from the dataset being visualized in the chart. This enables them to clean and refine the chart by removing data that is not relevant or necessary for analysis at that moment.
Steps to Remove Data Items in a chart:
- Open Dashboard Designer.
- Create a new report or open an existing one.
- Select the chart.
- Click on the "Remove Data Items" icon.

Transpose
This action allows the user to interchange the 'Arguments' and 'Series' or 'X' and 'Y' axes, depending on the type of chart to which this action is applied. This can provide a new perspective on the data and facilitate its understanding and analysis.
Steps to Transpose values in a chart:
- Open Dashboard Designer.
- Create a new report or open an existing one.
- Select the chart.
- Click on the "Transpose" icon.
![]()